Submitted by mydriase t3_10imlqc in dataisbeautiful
Comments
mydriase OP t1_j5f51ae wrote
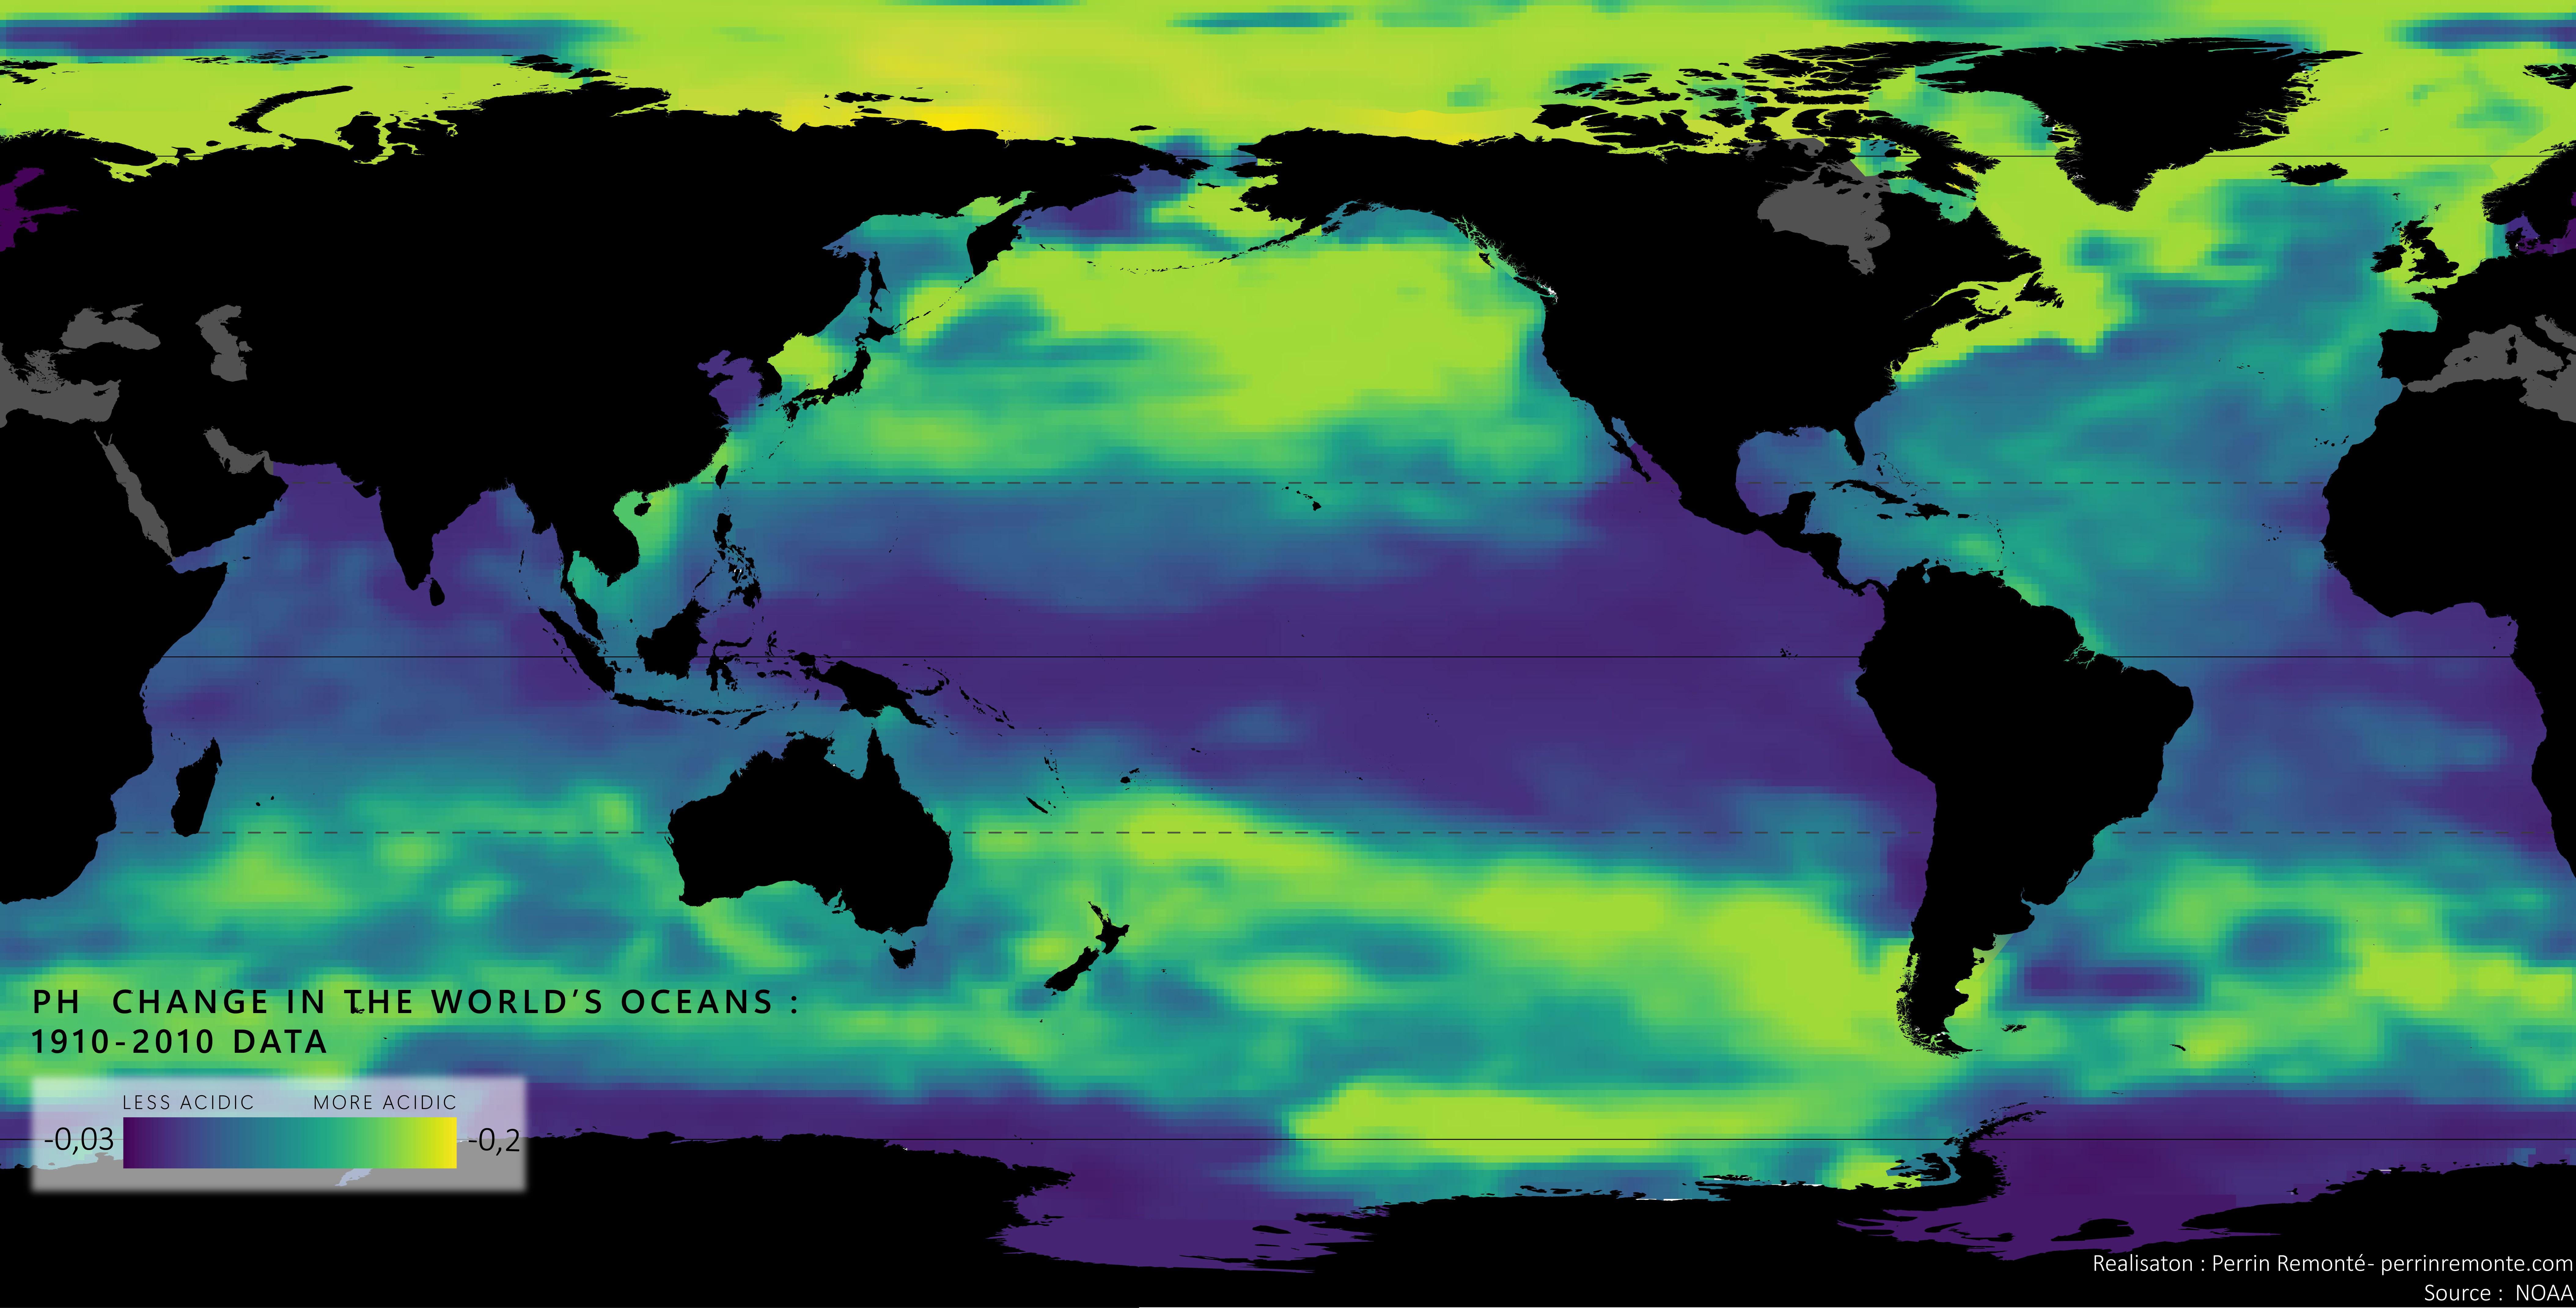
well ... there are colors ... there is a key to understand the colors. the rest is up to you :)
Impressive-Sort223 t1_j5f58pk wrote
I understand that there is a key. I see that the green means that there is acidity. How is that significant if I cannot see before it was acidic? This is just the end result. We need to see when it started in 1910 and the end result in 2010.
mydriase OP t1_j5f5bja wrote
No, -0,2 means it decreased by 0,2 between the two dates
Impressive-Sort223 t1_j5f5ed0 wrote
Ahhhhh pardon my misunderstanding and thanks for helping me see that.
mydriase OP t1_j5f5gl1 wrote
No problem ! I hope it won’t be confusing overall
Impressive-Sort223 t1_j5f5iq1 wrote
Nope, very interesting stuff! Thanks for sharing.
[deleted] t1_j5gzyaq wrote
[deleted]
Square_Tea4916 t1_j5fjp6y wrote
Interesting how it's less acidic in the middle. Wonder what it would look like with a Shipping Route Overlay.
mydriase OP t1_j5fkf3i wrote
So the logic behind this map, as far as I know it, is that, from a purely chemical point of view, cold water is more acidic since the amount of CO2 that can dissolve into water is inversely proportional to the temperature.
So, this would mean cold water becoming warmer,because of climate change, should be less acidic. But then, in reality, more biological processes take place in warmer waters. These processes releases CO2 and acids. So water ends up getting more acidic
This degree of change is exacerbated by the fact polar waters are warming up much faster than the others on earth
That’s why it’s bright yellow, others who didn’t change so much are likely to not have warmed so much (or other reasons I don’t know)
Significant-Return21 t1_j5fol6k wrote
Those darker regions along coasts and equator reflect upwelling where cold water is transported to the surface.
mydriase OP t1_j5fp6kk wrote
Thanks. I thought upwelling was bringing water along the coasts of Peru / Chile and Nambia ? Is it also happening in the middle of nowhere ?
mydriase OP t1_j5fleyf wrote
Also, I’ll add some patterns across oceans are currents, like you see in the northern Atlantic Ocean. The cold waters on the east coast of Canada are colder than those coming from warmer regions, so they get this sped up acidification effect…!
Also, it doesn’t show on the map so well but coastal waters tend to have a higher pH because of human activity and river discharge (bringing waste waters)
Square_Tea4916 t1_j5fny1o wrote
Thanks, this is awesome! I was kind of shocked seeing the water near the Panama Canal wasn't as acidic. Maybe it does have more to do with current patterns.
mydriase OP t1_j5fob8m wrote
The data resolution is very coarse so maybe it is very acidic locally (I haven’t read anything about ship lines and acidity though !) and the data doesn’t allow us to see it …
MagicJava t1_j5iis8y wrote
The middle could be more acidic and we wouldn’t know from this map. Just shows the change
Dazzling_Increase_48 t1_j5i9gdr wrote
We should also consider the water currents , which transport from one area to other
il_duomino t1_j5ilvxj wrote
In the grand scheme of things, this is bad I guess. I know very little about ocean aciditiy. This change is due to pollution and it changes the environment for sea life. Does it also affect weather, climate, temperatures?
Rugfiend t1_j5fgtjy wrote
Sadly, this does nothing for armchair expert denialists - the implications are meaningless to the clueless.
mydriase OP t1_j5fjknm wrote
Agreed. I will post the same map with a comprehensive overview of the topic, with more info and figures. But since this sub seems to appreciate simpler maps (because the map I made is a 3-4 mns read and no one has time) I’m posting this in the meantime
[deleted] t1_j5g4hdu wrote
[removed]
Glittering_Line_7643 t1_j5jgkcc wrote
I read it as the evolution of audacity in our oceans
mydriase OP t1_j5jirj9 wrote
How dare they, getting more acidic ? Tsssk the audacity
Lyrebird_korea t1_j5k5wcn wrote
Oceans are not acidic, they have a pH > 7 and that is not going to change any time soon. Your title is misleading.
mydriase OP t1_j5k7a4v wrote
WTF ? I am not saying they’re acidic. I’m saying they are getting more acid. The pH has dropped by 0,2 during the period shown here. This means +30 in acidity. Not acid yet but it is definitely getting more acidic
Lyrebird_korea t1_j5kanaz wrote
It is not getting more acidic. It is getting less alkaline.
mydriase OP t1_j5kggxg wrote
You’re right, but at this point everyone (the researches as well I think) say this. It’s the common way to designate the topic. It’s also simpler and more understandable that way
mydriase OP t1_j5f4tj0 wrote
For this map I used the free data on NOAA (national Oceanic and Atmospheric Administration) and used QGIS / adobe illustrator process the data.
I will post a much more elaborate map tomorrow, adding a ton of extra information but wanted to share this simpler, straight forward version map of the topic.
In the meantime, you can find more cool maps, articles and even photographs on my website where I write about topics with a geographical point of view (hence the maps).
cheers :)

Impressive-Sort223 t1_j5f4uus wrote
How are we supposed to tell what changed?