Comments
[deleted] t1_j4u7yam wrote
[removed]
[deleted] t1_j4u845n wrote
[removed]
despalicious t1_j4u8duo wrote
Fun! Any insight into the influence of changes in maximum GPA over that time?
Deadwifi9000Ping OP t1_j4u9kyy wrote
There is probably influence of "Grade Inflation" on the overall increasing admittance GPA for these schools.
​
Here's an article by Inside Higher Ed about grade inflation(incl. overall GPA) both in Colleges and High School:
despalicious t1_j4uafad wrote
I would have hoped for that author to mention the phenomenon of schools switching from a 4 max grade point to 5. In 1994, at many schools straight A’s full of AP classes would get you a 4.0.
Deadwifi9000Ping OP t1_j4ugyib wrote
You are right. I'm not 100% confident on this whether they adjust unweighted GPA to weighted for those years. I know there are some 4.0+ GPA(so weighted) schools for 1994, but whether or not the other datapoints are adjusted is definitely something to look at.
buzzzzz1 t1_j4us9rv wrote
I'm old but when I was in high school 4.0 was the top. You could have cured cancer and not get a 4.01. I'm not sure what's right or wrong but a top seems to make sense.
Deadwifi9000Ping OP t1_j4utmas wrote
That's interesting to hear! I know there are schools out there that still use unweighted system, but weighted GPA seems to be the primary for most schools now. I'm definitely curious about whether or not weighted GPA was still used by some schools back then, or 4.0 scale was just the standard for most/all.
darshan_yandigeri t1_j4vchhy wrote
How do you create these dynamic charts?
[deleted] t1_j4veumx wrote
[removed]
watisee t1_j4vi7rr wrote
Depending on when OP went to school it may have been before AP classes were created (which are graded on a weighted 5.0 scale)
DrTonyTiger t1_j4vngei wrote
Students (or their parents) with a GPA over 4.0 may think that is evidence that they are better than perfect. But faculty who grew up when 4.0 was the max see that and think their GPA must be completely bogus. So it can backfire.
Deadwifi9000Ping OP t1_j4x2sz3 wrote
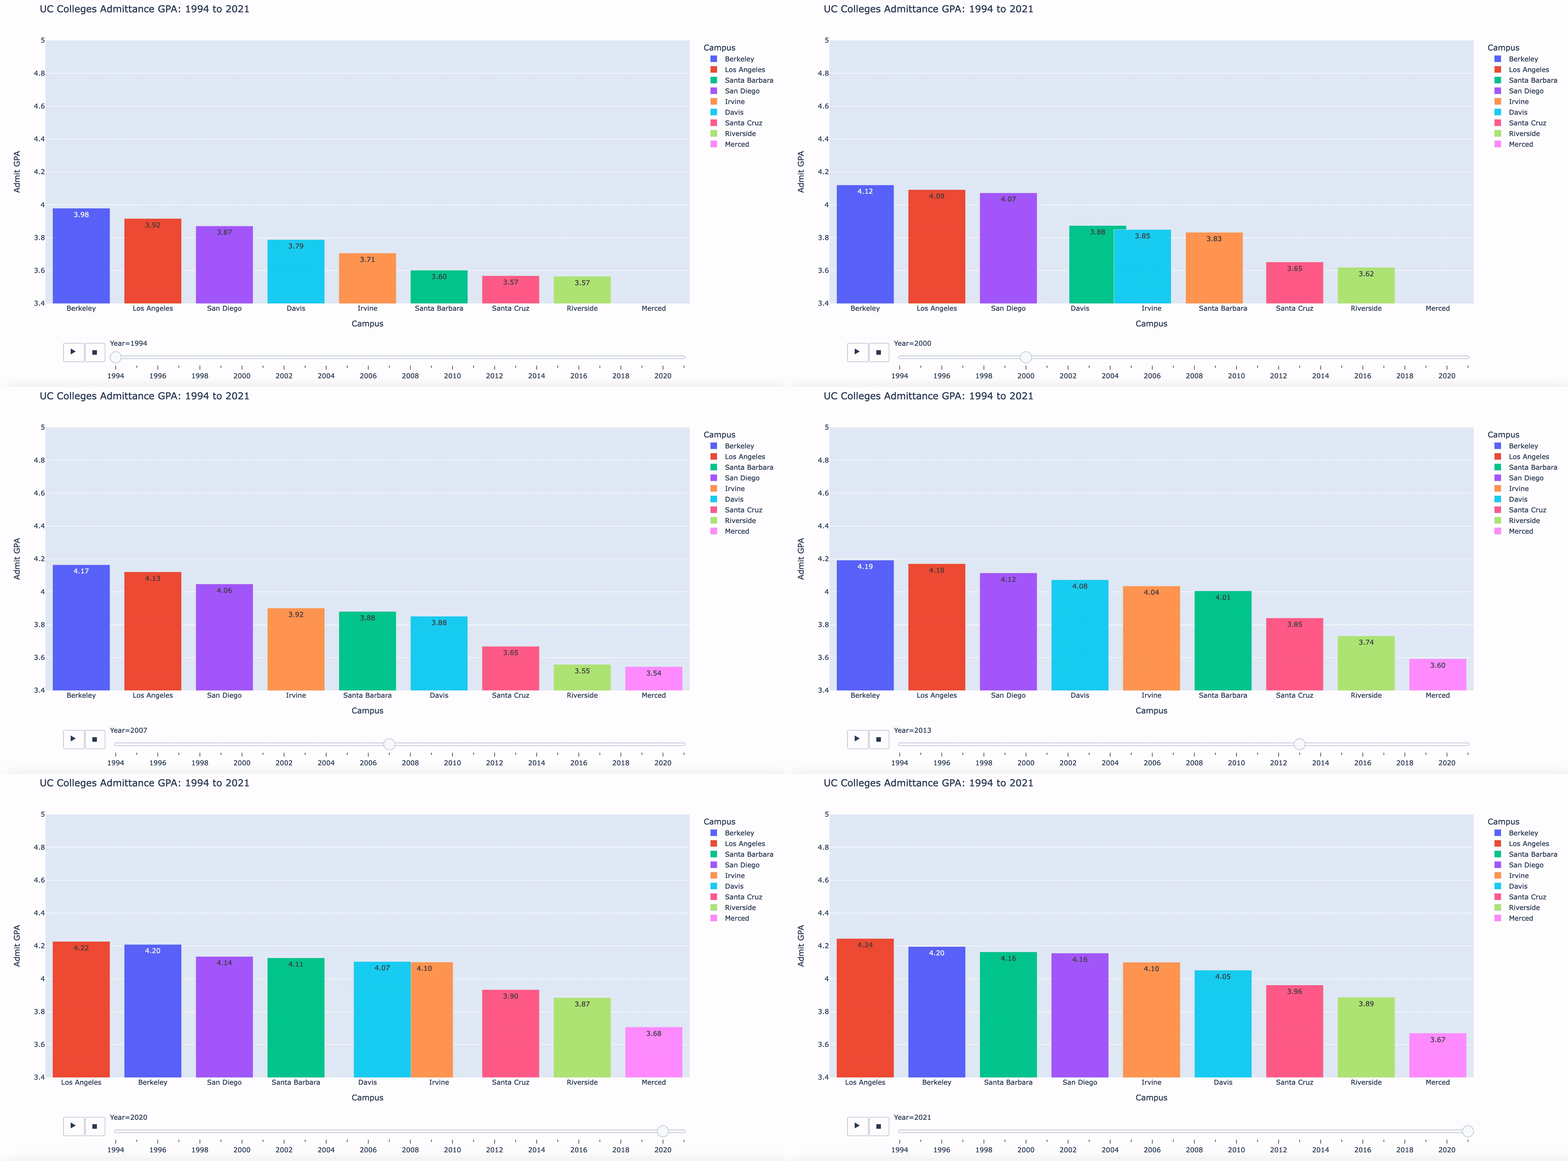
I used the Plotly library to make this. I think there’s also the bar_chart_race library others use to make similar animations, but I prefer the customization variety available on Plotly

Deadwifi9000Ping OP t1_j4u2nlz wrote
Hey guys!
I made this animated visualization for a school project. It compares how the average GPA of students admitted changed over time for the different UC schools.
One thing to note is that UC Merced does not appear until 2005. This is because UC Merced was founded on September 5th, 2005, so there is no data on admissions before that date.
I used Plotly and got the data from the University of California’s published data. https://www.universityofcalifornia.edu/about-us/information-center/admissions-source-school