Submitted by EngagingData t3_10l43wa in dataisbeautiful
Comments
EndlessHalftime t1_j5v2jln wrote
One pice I think you may be missing is that not all of the snowpack is useful. Snowpack in a reservoir’s watershed is basically additional water in the reservoir. But snowpack that does not melt to a reservoir is will just flow into the ocean.
So you’re adding water (damed) with snow (damed and undamed). It’s not something that’s really fair to add together.
Or that’s accounted for in the 2016 paper and I just misunderstood.
[deleted] t1_j5w2gwl wrote
[deleted]
EngagingData OP t1_j5v5sx5 wrote
You are correct that not all snowpack melt water can flow through a reservoir. I guess perhaps my wording is confusing. The snowpack is like another reservoir in that it stores water, but it's not exactly like a reservoir, in that all of that water will be captured.
40for60 t1_j5viyjm wrote
but how many pools will this fill?
Thenerdy9 t1_j5uon4j wrote
I think it'd be a more informative graph to compare to historical data before the decades-long drought?
EngagingData OP t1_j5v22uy wrote
The problem is the snow sensor data isn't available before the 70's and 80's.
Thenerdy9 t1_j5vbovo wrote
I don't think you need to go back further... just maybe choose years that don't include drought?
> Drought in California from 2000–Present
> The U.S. Drought Monitor started in 2000. Since 2000, the longest duration of drought (D1–D4) in California lasted 376 weeks beginning on December 27, 2011, and ending on March 5th, 2019. The most intense period of drought occurred the week of July 29, 2014, where D4 affected 58.41% of California land.
EngagingData OP t1_j5vsbub wrote
that makes sense, I misunderstood you earlier comment.
Thenerdy9 t1_j5vcv3w wrote
sorry I couldn't find the data for exact years but, you seem more resourceful than me so I bet you'd hqve more luck finding those dates if you decide to take my suggestion to improve your graph :)
Bearvibe t1_j5uujji wrote
So is California doing good again or not? Does this mean we are at or near or exceeded water levels? No more drought?
IkeRoberts t1_j5wo45f wrote
The drought is also expressed in soil and groundwater storage. That is still low. Is there a way to get at that part of the California drought story?
General_Chairarm t1_j5uvsca wrote
No, the snowpack will melt quickly if not refreshed often, same with the reservoirs. Cali needs more, consistent snowpack and rainfall to exit the drought. Otherwise it will just re-intensify next summer.
meatpopsicle_sic t1_j5vtmwr wrote
It's like they could benefit from more reservoir capacity or some strange idea like that.
constantino675 t1_j5v4as0 wrote
This is why desalination never happens, drought breaks, things fill up, apocalypse doesn't come, media has to go back to reporting celebrity breakups.
somehobo89 t1_j5wn17z wrote
Nah this isn’t gonna “fill it up.” Not even close - these are high relative to the median, the total water deficit is much greater.
constantino675 t1_j5wplnz wrote
I dont understand, why would the deficit be measured against something other than the median?
somehobo89 t1_j5wxbww wrote
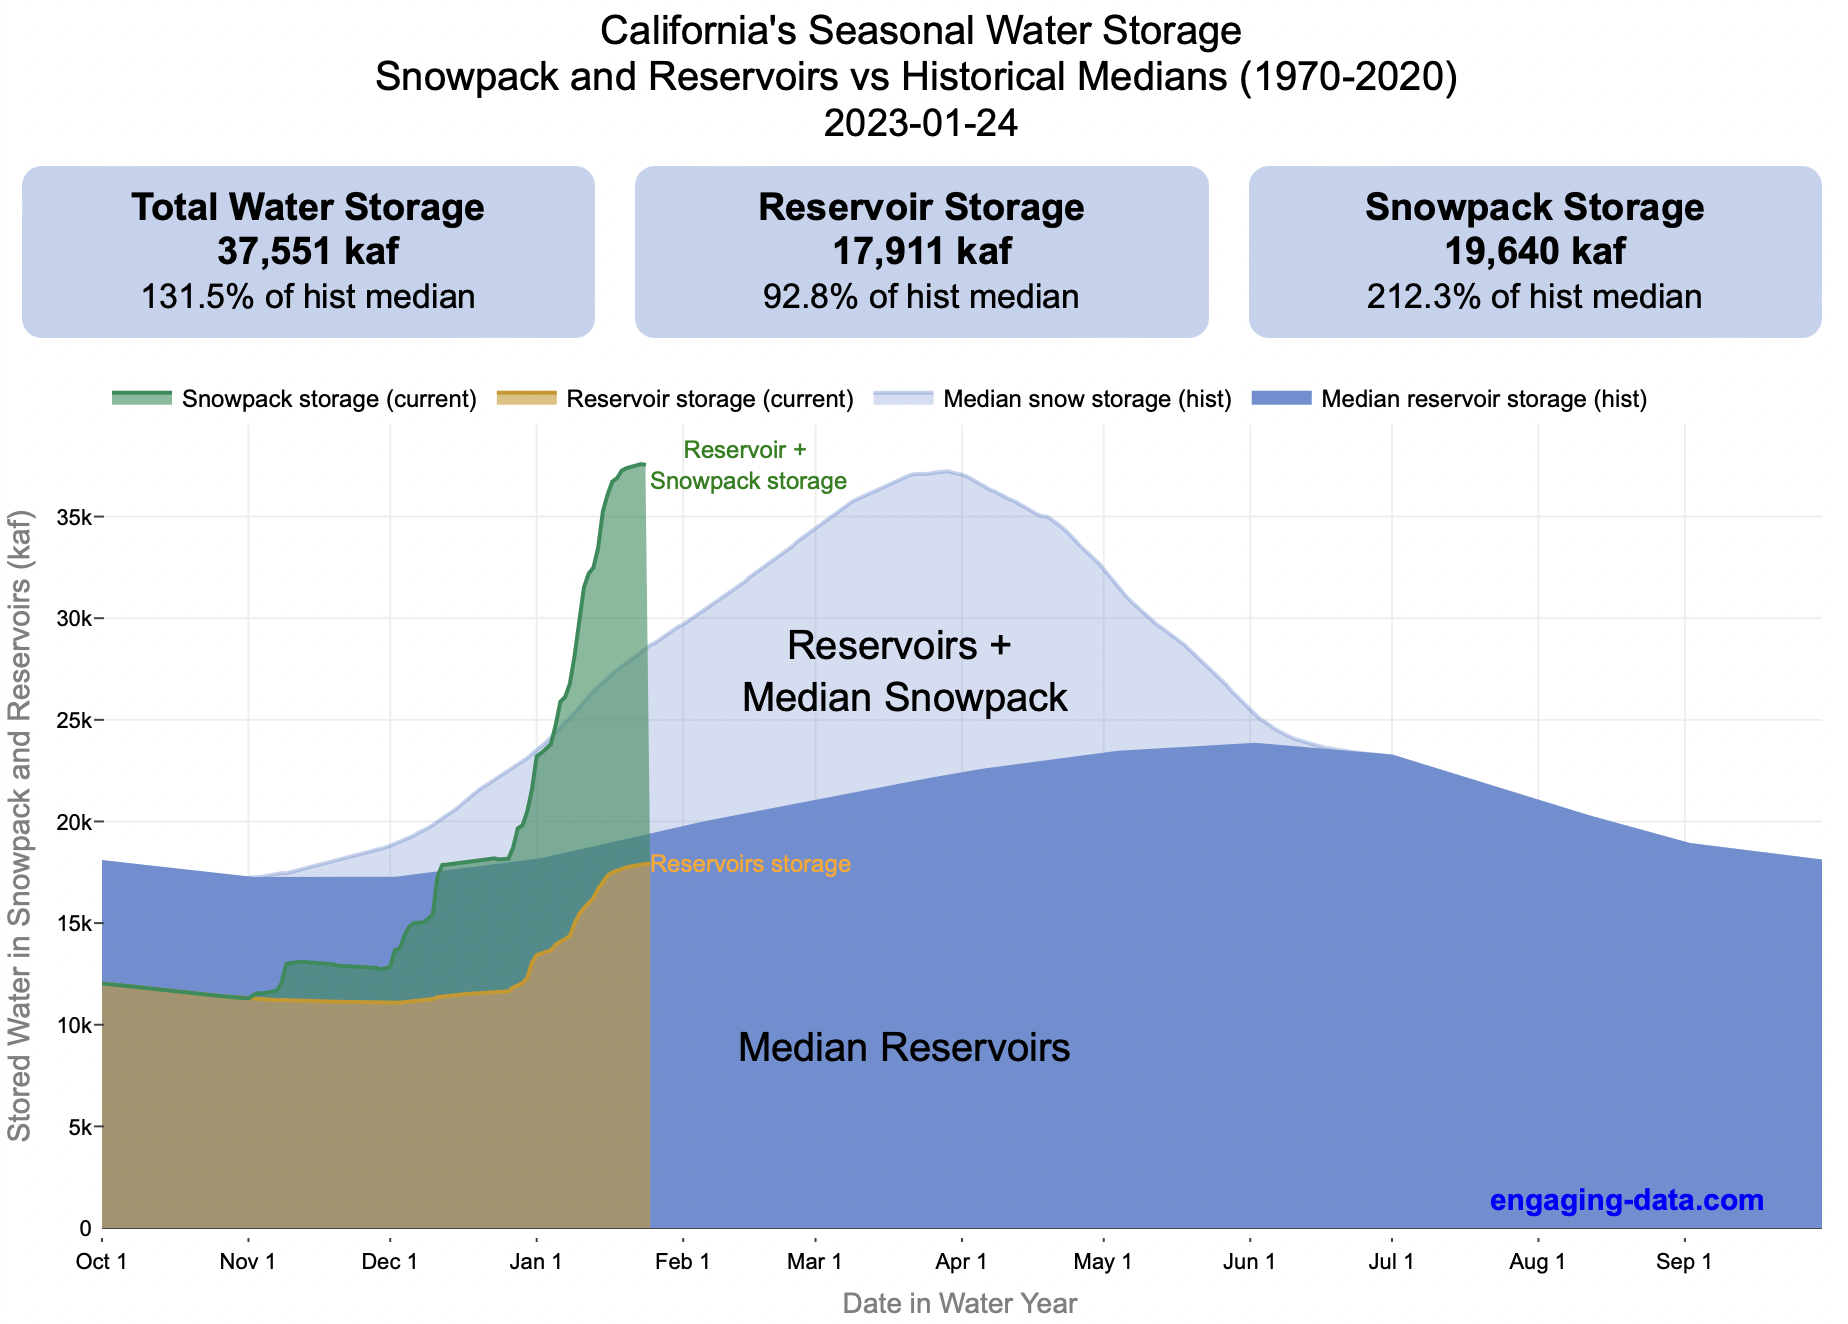
This is actually a really cool graph. What it is showing is that the total water in storage now is far higher than it is in a typical year at the same calendar date, and that most of it is in the snow pack.
But that does not equal an end to the drought. The drought has been multiple years of below median total water storage, and it will take several consecutive years of gains like this to recover from the drought.
If Lake Meade fills up to normal capacity this summer I’ll eat my shoe keep an eye out for it
[deleted] t1_j5xlmqu wrote
[removed]
Ill-Construction-209 t1_j5y5tqm wrote
Is rhis helping to restore the aquifer levels?

EngagingData OP t1_j5uh2oi wrote
California’s snow pack is essentially another “reservoir” that is able to store water in the Sierra Nevada mountains. Graphing these things together can give a better picture of the state of California’s water and the current conditions of drought. The recent atmospheric rivers have increased storage in reservoirs and snow in California immensely.
Click here to view interactive version that is updated daily.
Converting snowpack water content (measured in inches of water at 120 different snow sensor sites in the Sierras) into a total volume of water was done by correlating snow sensor data with an estimated the volume of the Sierra snow from 2016 journal article (Margulis et al). See link for more info.
Sources and Tools
Snow and reservoir data is downloaded from the California Data Exchange Center website of the California Department of Water Resources using a python script. The data is processed in javascript and visualized here using HTML, CSS and javascript and the open source Plotly javascript graphing library.