Submitted by df_iris t3_zl3bjk in dataisbeautiful
Comments
[deleted] t1_j03js6t wrote
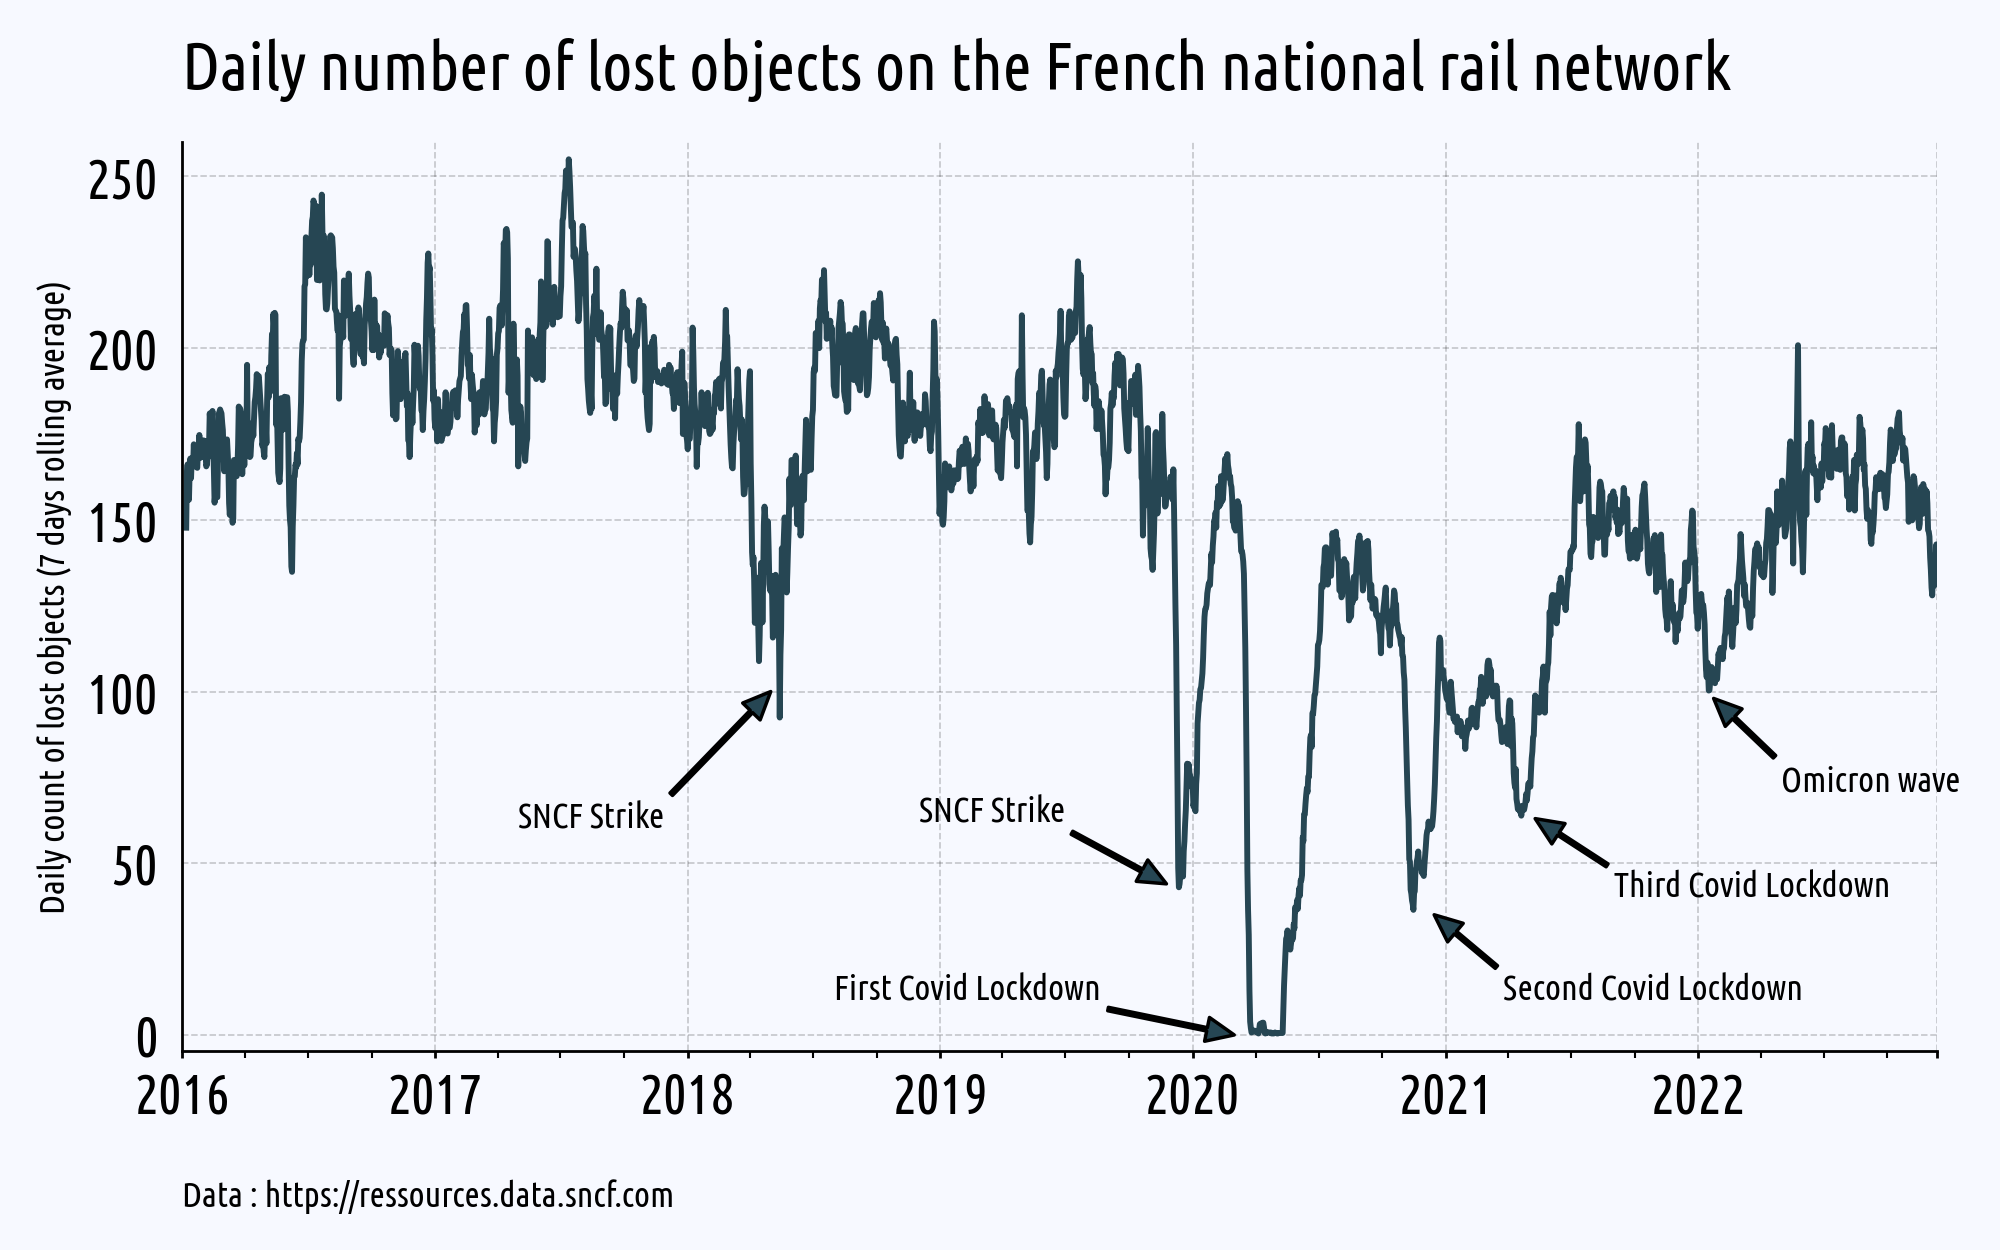
They tend to lose more objects in the middle of the year, a recurring pattern even in 2022 after all the lockdowns messed with it. Perhaps the number of commuters increase with all the tourists visiting in the summer. Then it would be more representative to use such parameter as number of objects lost per passenger, I think. Though I can't imagine the real life application of this data lol.
teamongered t1_j05r7jn wrote
Pretty interesting and unique dataset. There seems to be a higher number of lost items in the middle of the year (summer?). Maybe due to more tourists? There are also some short-term spikes in more lost items… I wonder what those correspond to.
PM_ME_WITTY_USERNAME t1_j05zky5 wrote
I bet there's spikes on rainy days because of umbrellas

df_iris OP t1_j030g8e wrote
Data : https://ressources.data.sncf.com
Tools : Python, matplotlib