Submitted by matt2001 t3_zicsp6 in dataisbeautiful
Comments
eohorp t1_izqtb6v wrote
Another look:
https://www.currentmarketvaluation.com/models/yield-curve.php
Every time this has happened in the last few decades has been accompanied with a recession
Wizard01475 t1_izqvnuq wrote
I’d like to think I know what I’m looking at. But what am I looking at?
matt2001 OP t1_izqx59z wrote
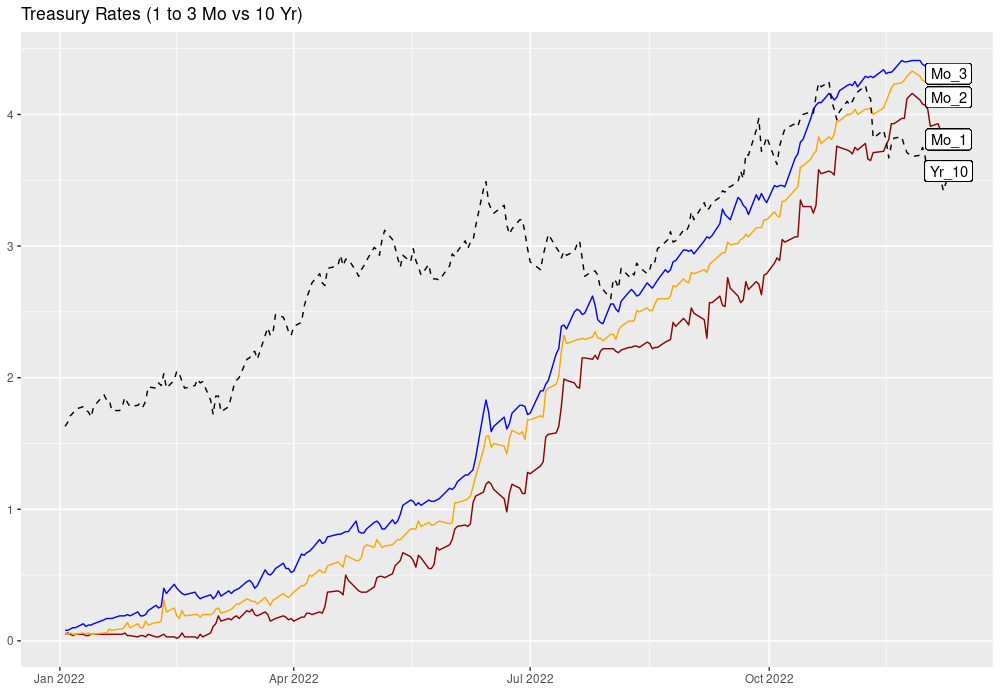
Interest rate paid by the government if you buy their treasury bills. You can buy various time frames. I've listed one month, two month and 3 month compared to a 10-year treasury.
We started the year with almost 0% interest and now we are at 4%.. The 10-year treasury bill is paying less than the shorter term treasuries. This often happens before a recession.
xman747x t1_izqz4f4 wrote
buying and selling treasury bills looks very tricky; how would you recommend the process be done?
matt2001 OP t1_izr0zrr wrote
There are some good YouTube videos on how to do this. It's actually quite easy and safer than buying stocks when interest rates are rising. Especially, if you stay with short term bills. All of the major brokerages allow you to buy treasuries.
I plan on staying in short-term treasuries and wait for longer term interest rates to rise.
matt2001 OP t1_izrtddm wrote
[deleted] t1_izrtj0l wrote
[removed]
Wizard01475 t1_izrznf6 wrote
Ah…so it’s the yield curve inverting over the year. That makes sense now. Thank you
CosmoKramerJr t1_izum28b wrote
Your labels aren’t clear. They assume the reader already knows exactly what you’re presenting. Pls fix

matt2001 OP t1_izqo335 wrote
Interest rate comparisons from 2022. Intersting to see rates rise from almost 0% to 4% with short term rates exceeding the 10 year.
Source:
US Department of Treasury Interest Rates 2022
Method: RStudio, GGplot2