Comments
YarrowBeSorrel OP t1_izgnpxc wrote
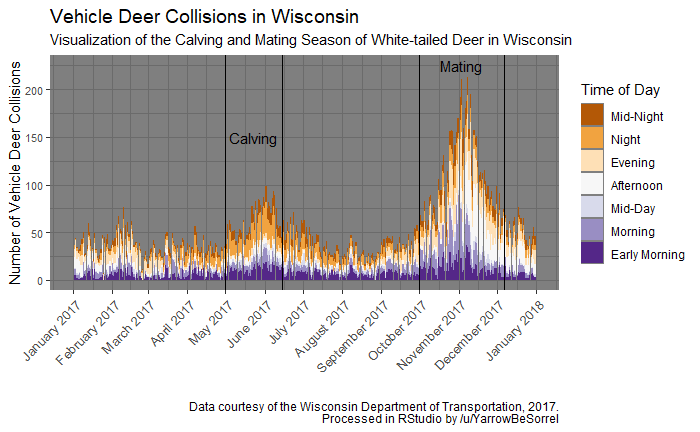
I think the difference in time of day between the two outlined areas to be intriguing as well. The time of day is split up in 4 hour intervals starting at 0600 for Morning.
The calving cycle sees a higher number of collisions between 1800 and 2200 whereas the mating cycle has a higher collision rate during the afternoon hours 1400-1800.
I would be interested to see how that compares to sunset times, but I’m not quite sure how to visualize that on top of what I already have here.
Chickensandcoke t1_izhkkll wrote
You could do a line chart with a Y axis of 1200-000 at the geographic center of Wisconsin.
YarrowBeSorrel OP t1_izhktjp wrote
I see. I’ll have to learn how to add that on top of my graph. I have an idea.
Alwayssunnyinarizona t1_izh953n wrote
Trivial, but cows, elk, and moose calve. In deer it's more appropriately called a fawning season.
YarrowBeSorrel OP t1_izhgqgj wrote
That’s what I thought. I saw calving on an online paper with a quick Google so that’s what I went with.
Alwayssunnyinarizona t1_izhen5j wrote
Also, for the sunris/sunset times (both are important), you can use the right y-axis and have it go from 0-24hrs.
I'll think on it and post an idealized image tomorrow.
YarrowBeSorrel OP t1_izhgirh wrote
I was just putzing around with that. There’s definitely a trend that follows sunrise sunset throughout the year.
YarrowBeSorrel OP t1_izghgdw wrote
Data was acquired from the Wisconsin Department of Transportation. The data was wrangled and cleaned in RStudio where it was also visualized.
I have finished my first class in a Data Science Program and decided to put my newfound skills to the test.
maxthe3 t1_izhkye4 wrote
This would be a great post to put in r/wisconsin
YarrowBeSorrel OP t1_izhl6b4 wrote
She’s already up on the fridge over there!
I have a few more visualizations I’d like to do. Next one is going to be a temporal map that shows individual collisions throughout the year. They’re really going to like that one.
SciK3 t1_izhik32 wrote
calving? last i checked deers have fawns
solid graph though, data checks out with... experience.
YarrowBeSorrel OP t1_izhjdc7 wrote
SciK3 t1_izhkfet wrote
interesting, seems the source that graph is pulled from is for "Horses, Deer, and Camelids" aka camels. Camel babies are called calves, so they just slapped that term in this? odd
YarrowBeSorrel OP t1_izhkwvh wrote
I think it’s an ungulate thing
ls10032 t1_izkj97d wrote
Don’t call my brother that, the PC term is hoofed.
Ok-Oven6169 t1_izhbd8j wrote
I wonder if hunting also impacts time of day
crabmuncher t1_izhcblf wrote
Do all forest ungulates mate around the same time?
YarrowBeSorrel OP t1_izhgla4 wrote
That I do not know. I only speak for the trees.
NotEnoughWave t1_izi7b06 wrote
So, either OP is really unlucky, drives really bad or during these seasons deer are easier to find and hit.
/s
mkaszycki81 t1_iziz51r wrote
May I suggest a different color scheme? Light yellow for noon, going to red for the afternoon, purple for evening, dark blue for midnight and then lighter shades of blue for closing to morning, and yellow for early day?
It would be more intuitive.
YarrowBeSorrel OP t1_izj21c2 wrote
This color scheme was chosen as its color blind safe. I can toy around with your idea too.

shiftyskellyton t1_izgl0hm wrote
This is really cool. As someone who lives in Wisconsin, I can attest that it's well known in the area to use extreme caution when driving in November.