Submitted by data_n_stuff t3_yynvj8 in dataisbeautiful
Comments
data_n_stuff OP t1_iwv5fzk wrote
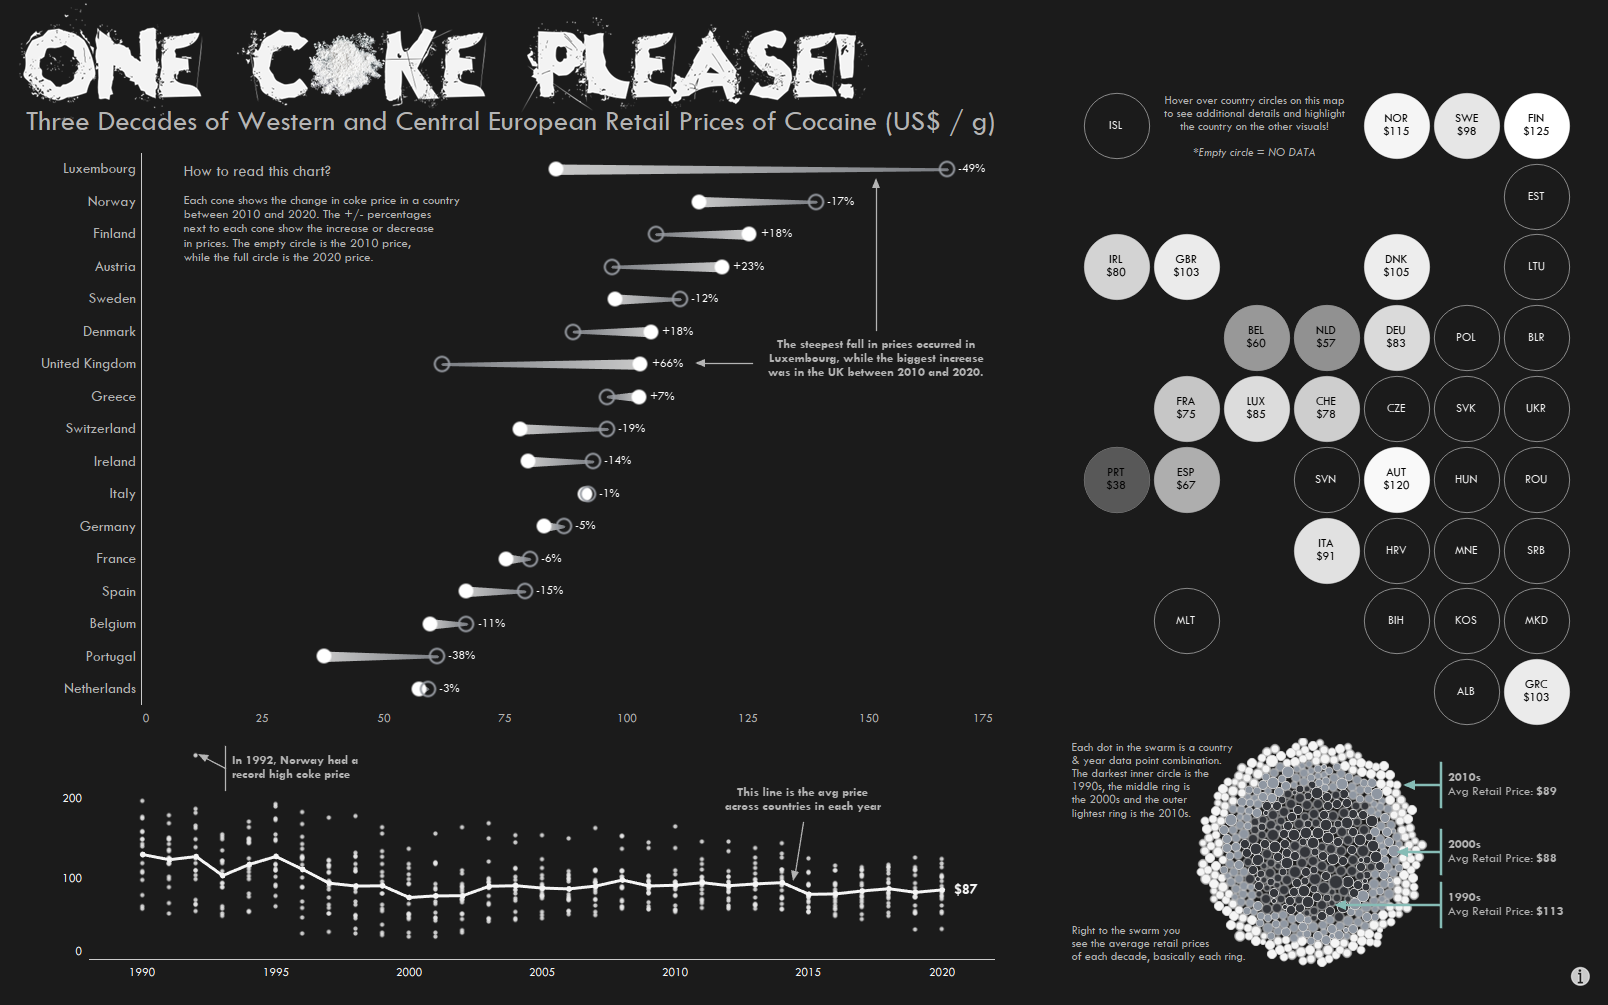
According to the source (UN data), US$ prices were converted from national currencies so there is a big fx rate effect. Also, figures are inflation adjusted.
namer98 t1_iww5ly3 wrote
It would ruin the aesthetic, but I would color code the lines in the price change graph. Red ones decreased, blue increased, or something. It is very difficult to read at a glance. But, very cool, love it.
LanewayRat t1_iww9fbu wrote
“One coke please” is what I say at the Macdonald’s counter, but it seems an unlikely way to “order” drugs 😂
data_n_stuff OP t1_iwyw5ey wrote
Cheers! I was also thinking about a blue orange colouring but at last decided to keep the aesthetics even if it would reduce functionality a bit

data_n_stuff OP t1_iwv57se wrote
Data source: https://dataunodc.un.org/dp-drug-prices-Europe-USA
Tool: Tableau
Interactive version:
https://public.tableau.com/app/profile/alex.l6463/viz/OneCokePlease/MakeoverMondayOneCokePlease3DecadesofEuropeanCocainePrices