Submitted by MetricT t3_z4ut5j in dataisbeautiful
Comments
MetricT OP t1_ixsugz0 wrote
Tools: RStudio, Google Trends
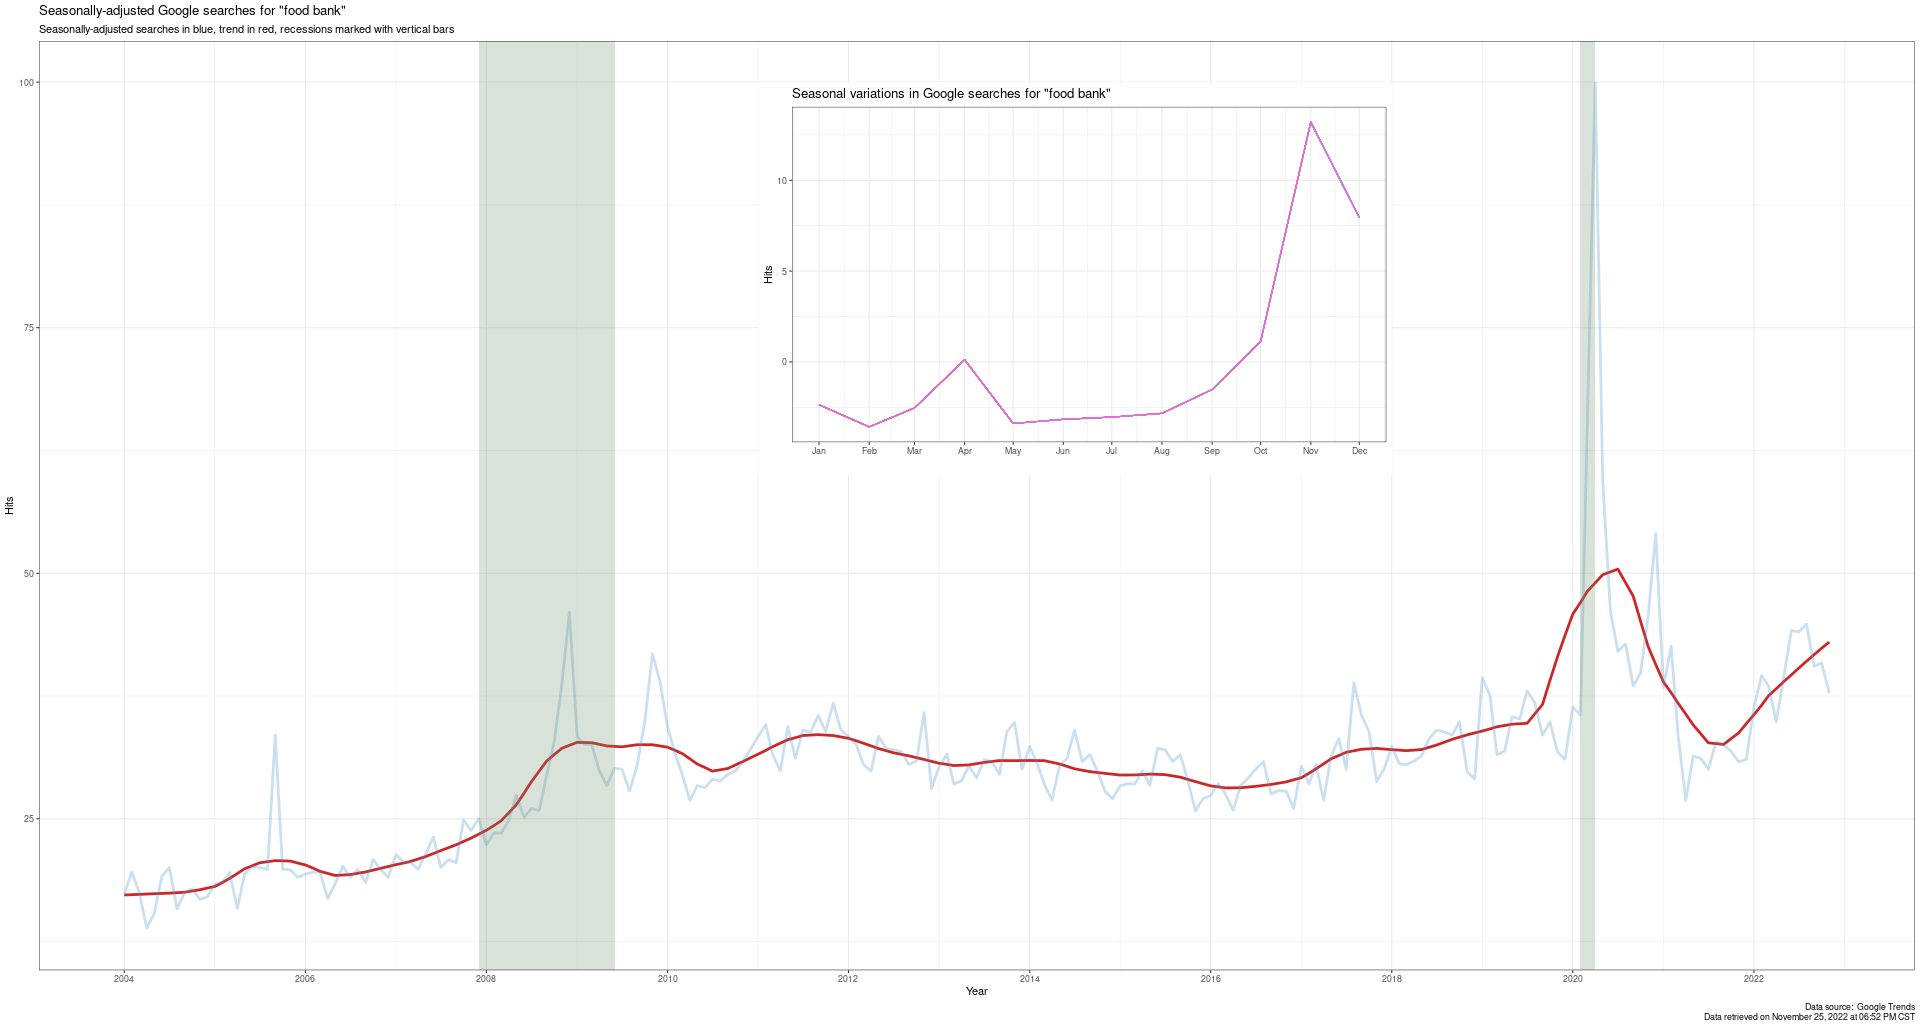
I suspected that Google searches for "food bank" would be a good recession indicator, and it seems to be so. In 2008, 2020, and unfortunately again in 2022 we see substantial increases in searches for food banks.
There is a strong seasonal component that I graphed in the inset. People do a lot more searching for food banks around the major family holidays (Thanksgiving, Christmas, and Easter, though strangly not the 4th of July).
I'm curious why searches rose and then fell back during the 2020 recession, but not following the 2008 recession. It's possible that it's due to technical factors (more people using the internet over the years, or the data not being normalized), but it looks like a lot of people who were forced to hit up food banks after 2008 weren't able to get back off them.
someguyontheintrnet t1_ixt55sv wrote
Do you account for increased searches over all? People used to use Yahoo and other search engines, and have less access to the internet than they do now. Maybe a moving average would help account for that?
[deleted] t1_ixth5yz wrote
[removed]
Stonx4Life t1_ixu3m5s wrote
You should add inflation rates to the graph!
[deleted] t1_ixwbu9v wrote
[removed]

Airrows t1_ixszbnp wrote
not beautiful at all
did you mention what the grey means?