Comments
REO_Studwagon t1_iw85sms wrote
FSU - most dangerous 3 loss team in the country.
billfitz24 t1_iw8mp3j wrote
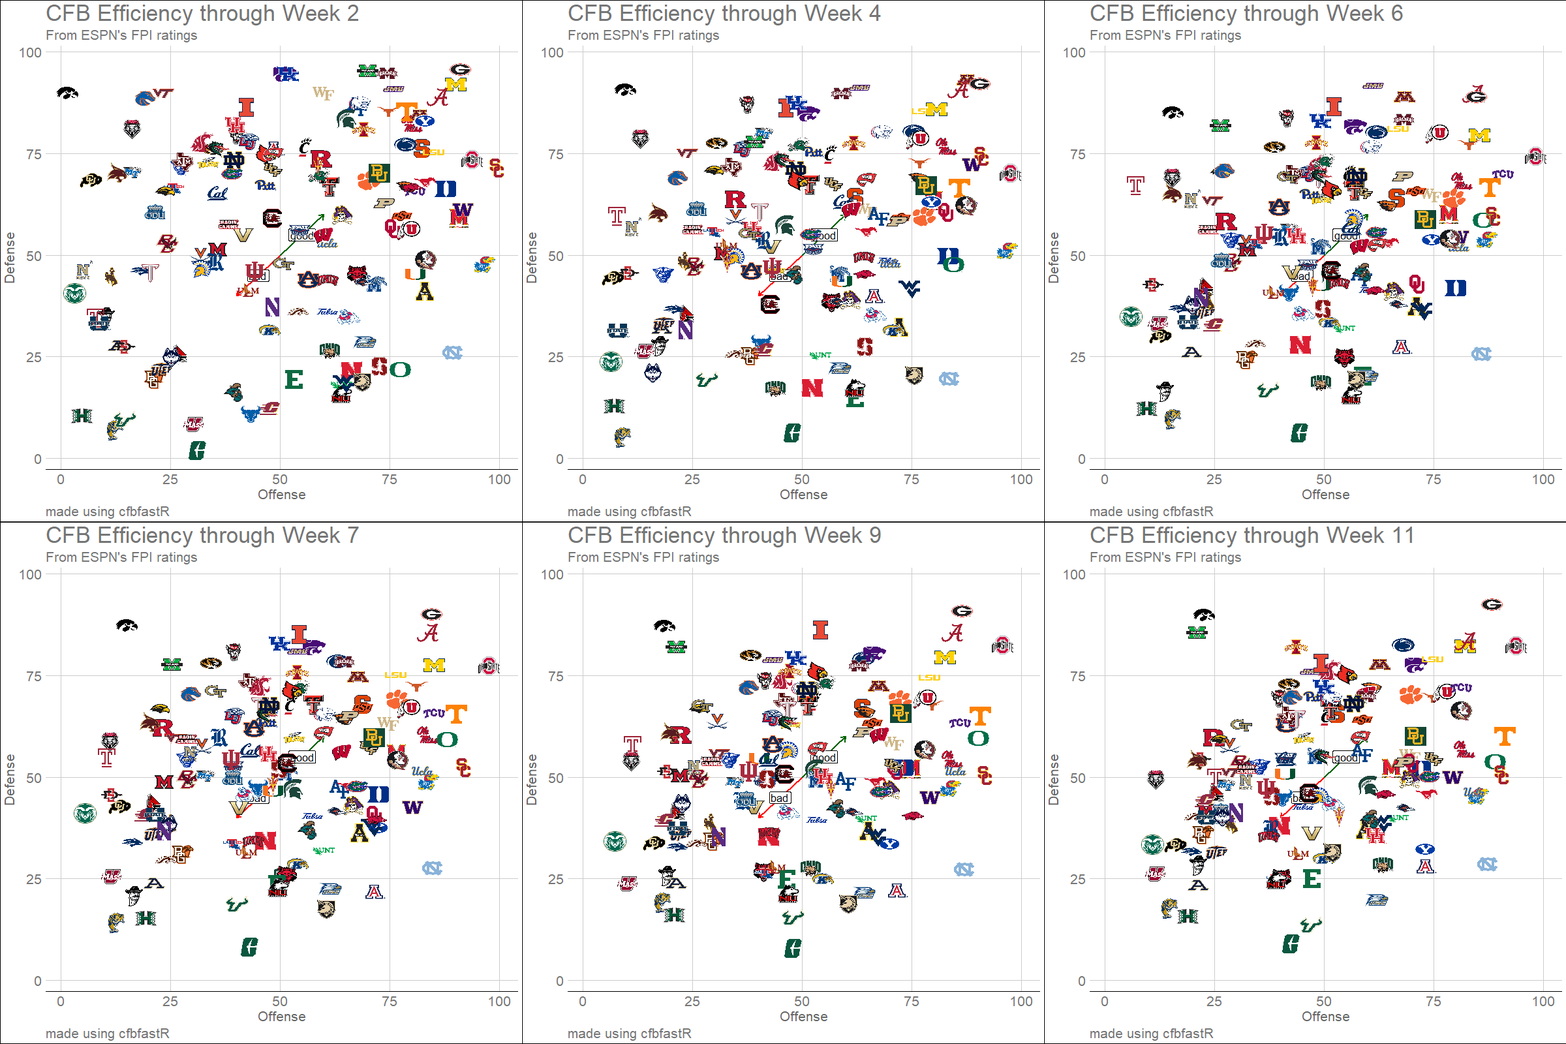
Who are those poor bastards in the lower left with what looks like a fish as a logo?
Bischrob OP t1_iw8t8jm wrote
Florida International - here's a closeup of the logo http://a.espncdn.com/i/teamlogos/ncaa/500/2229.png
billfitz24 t1_iw8wh27 wrote
Ahhhh, thanks.
rink_raptor t1_iwa0j35 wrote
Iowa REFUSING to be anything but the best defense and worst offense....
[deleted] t1_iwa1pop wrote
[removed]
MOBE_the_Hippo t1_iwa662j wrote
Finally someone has quantified how terrible Iowa games are to watch
eventuallobster t1_iwa9pqi wrote
Any numbers on a line of best fit and how well the data matches it? Just curious because the correlation here looks a lot weaker than I would have guessed it would be.
TearComplex5153 t1_iwaauxs wrote
Way to go NMSU! Holding down the bottom right square! Whooo!
Bischrob OP t1_iwagxu8 wrote
Indeed it is weak. Slightly positive correlation with adjusted R-squared of .1
BruinThrowaway2140 t1_iwazxkw wrote
U$C thinking they're hot shit. Classic 😂
Supr7FYCO_Suplexr t1_iwb9rt7 wrote
They’re good wym
BruinThrowaway2140 t1_iwbayn3 wrote
Good, yes. Great? To be determined. Overrated? Absolutely.
heresacorrection t1_iwfxdjr wrote
Please edit this to include source of the data plotted
[deleted] t1_iwgnxis wrote
[removed]

Bischrob OP t1_iw82x5a wrote
Made in R using these packages: cfbfastR, ggimage, tidyverse, gganimate, ggthemes.
Edit: data from ESPN using cfbfastR package
Explanation of FPI efficiency: "Team efficiencies are based on the point contributions of each unit to the team's scoring margin, on a per-play basis. The values are adjusted for strength of schedule and down-weighted for "garbage time" (based on win probability). The scale goes from 0 to 100; higher numbers are better and the average is roughly 50 for all categories. Efficiencies update daily during the season." It's basically an advanced metric designed to measure offense and defense.