Submitted by eqqqxy t3_yocc2a in dataisbeautiful
Comments
MrPickles113 t1_ivdpcud wrote
Russian source: trust me bro.
dootrumpet t1_ivdtgc3 wrote
well ignorance isnt good
JiveTalkerFunkyWalkr t1_ivdv3y7 wrote
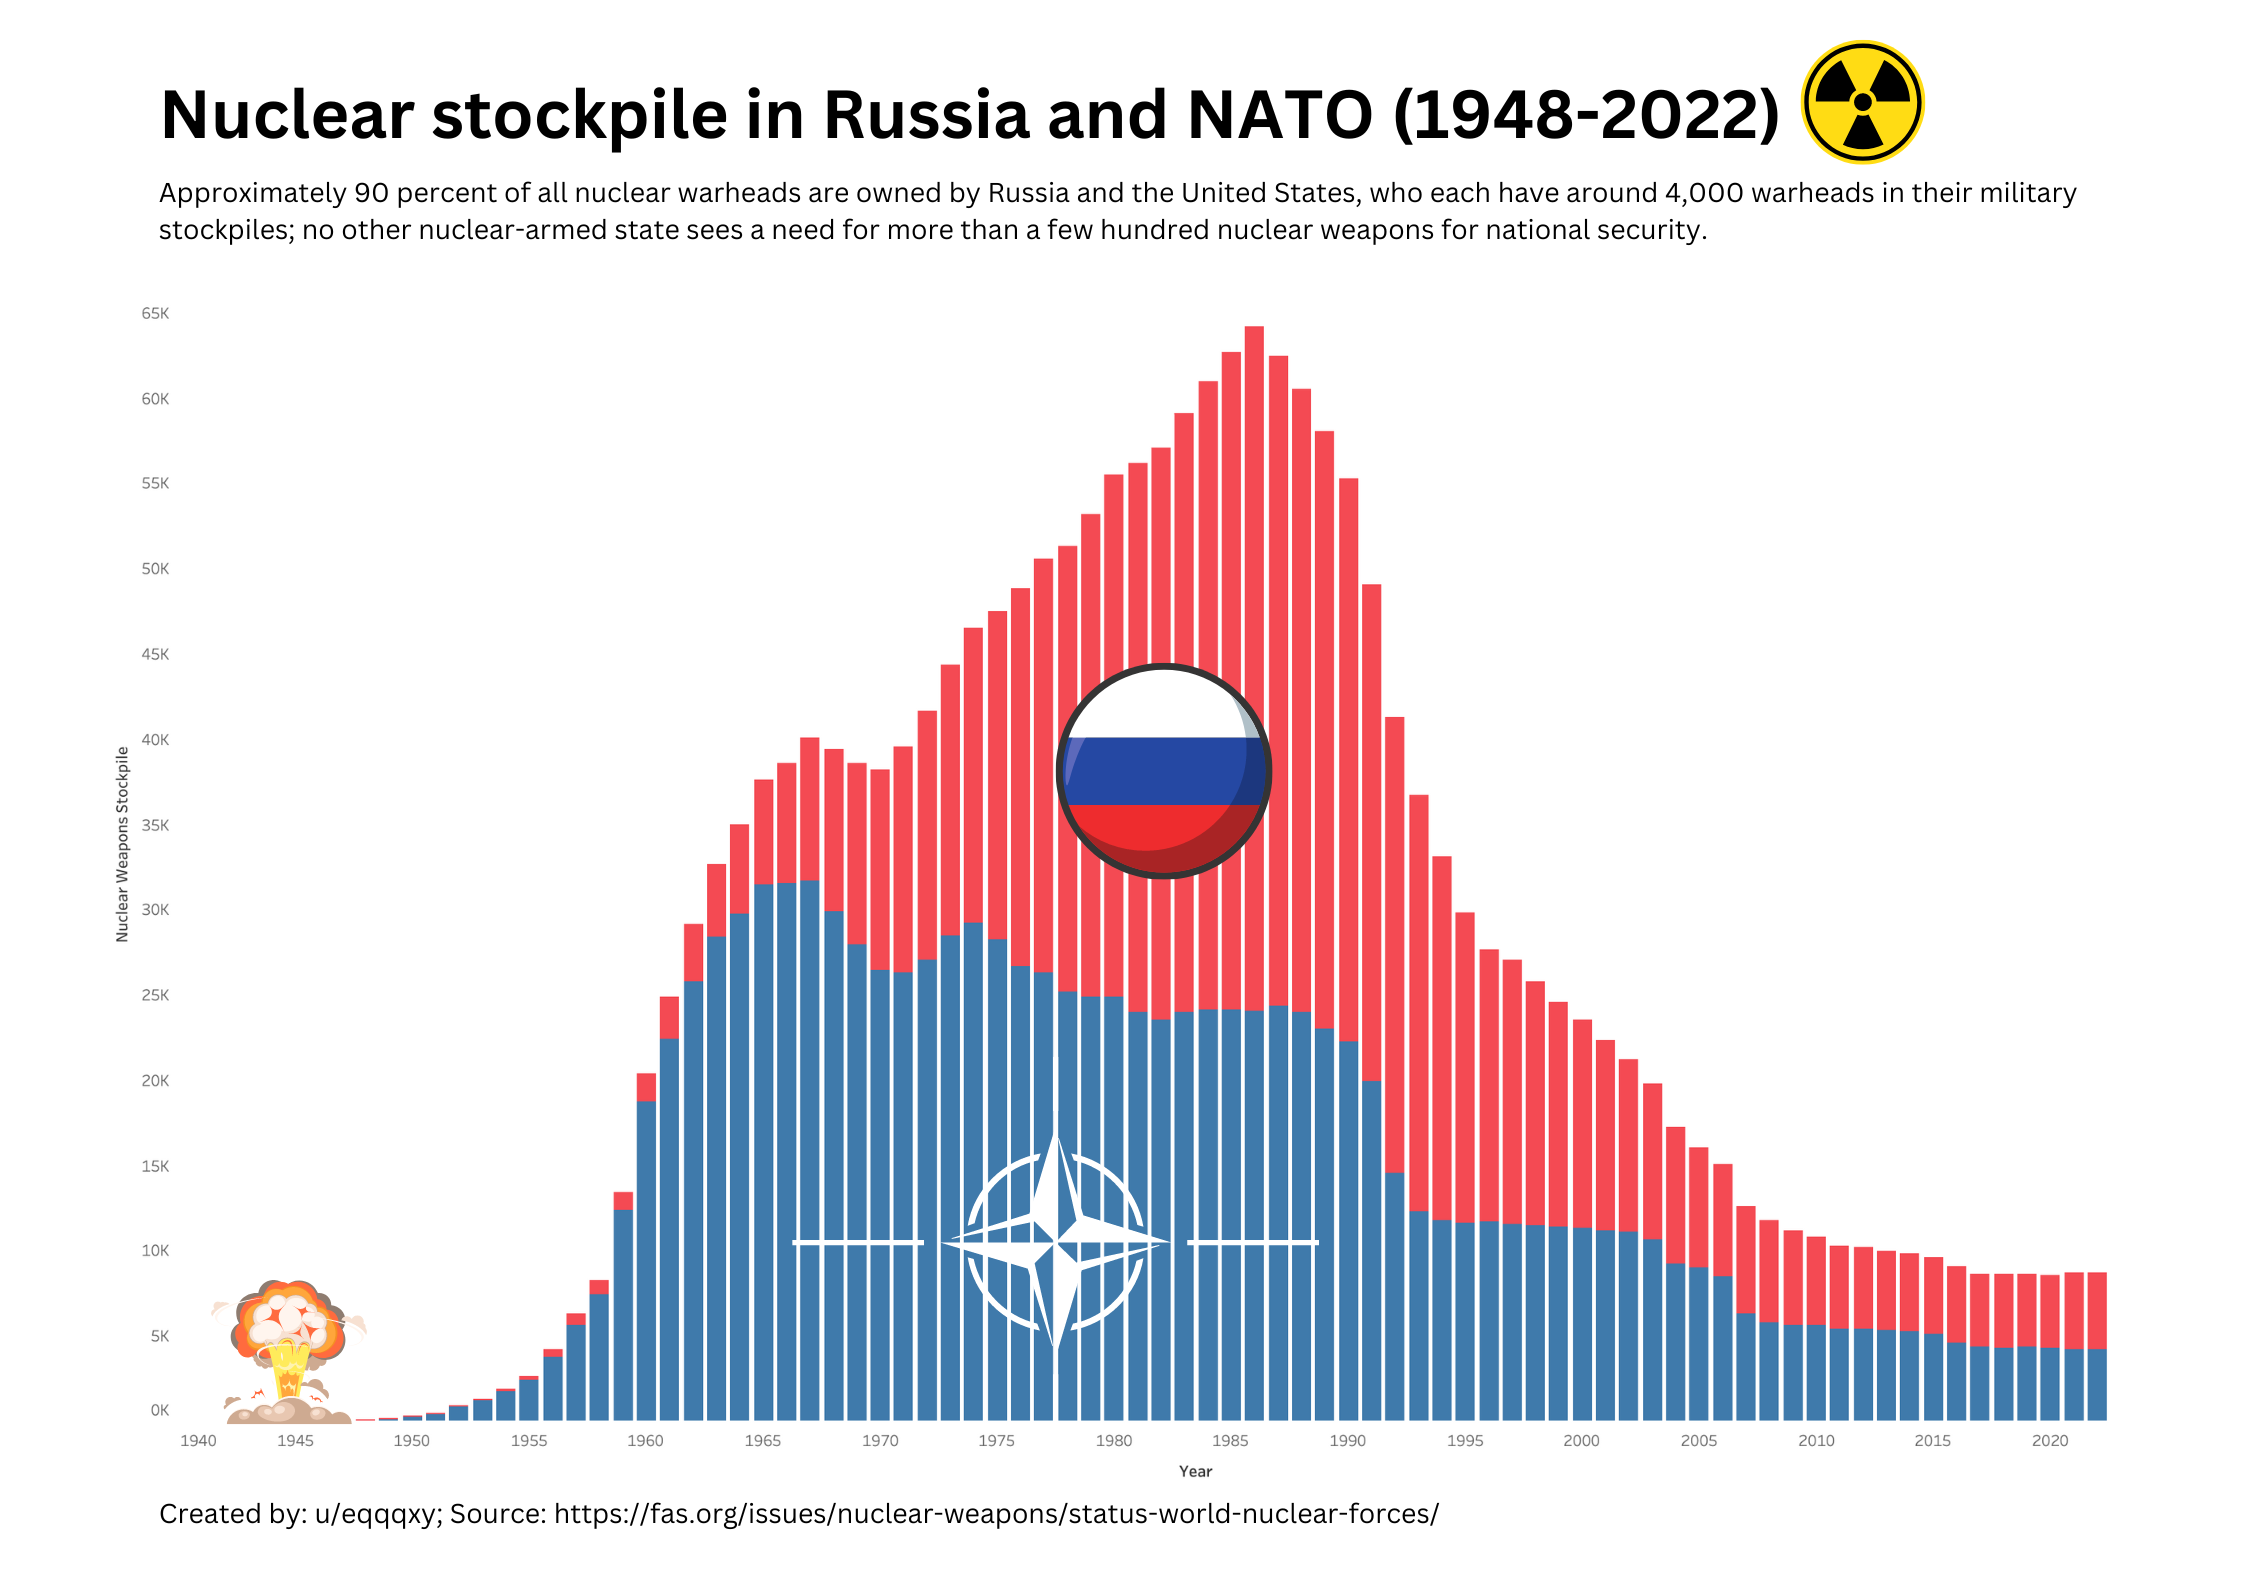
Where did all the 1985 nucs go? Used for reactors? Or just stored?
0mgt1red t1_ivdz9g2 wrote
Both sources are exactly that, none really discloses this type of data
schwabbbel t1_ive0ns4 wrote
Frankly, I find the chart from the source link is more informative.
jmihj t1_ive2j1k wrote
I can say the exact thing about american nukes
Mean_Permission8393 t1_ive5fb6 wrote
So the explosion in the start was about 8k pieces high?
Biguwuiscute t1_ive9zss wrote
It’s not that complicated actually. A nuclear bomb is, extremely simplified, borderline critical uranium surrounded by explosives. Remove the explosives, and you almost have a fuel rod. So yes, nuclear energy.
StationOost t1_iveb23b wrote
China is at about 3% of these numbers (350 in 2022 as estimated by the US), so it might not even be a pixel in the chart.
Ghostforever7 t1_ivebpii wrote
The thing that is so deceiving about this, is that it applies the stockpile is lower and better. The countries have less bombs, but the bombs are significantly more powerful than the ones first manufactured.
TheSn00pster t1_ivees8n wrote
One more 1993, and we could be done with them. 👀
jbeeziemeezi t1_iverla1 wrote
Guys let’s only be able to completely kill each other a little bit
685327592 t1_ivf1rx6 wrote
Fuel rods are enriched less than 5%, bombs are over 90%.
True_Parsnip8418 t1_ivf6yhs wrote
This is definitely not beautiful.
bremidon t1_ivfaj6e wrote
Are you not used to reading charts?
By the time the Soviets started their linear increase, NATO was already decreasing its stockpiles.
Having lived through it, I can assure you that the message was not: "we can do it too," but "we will bury you."
AshbyLaw t1_ivfh50b wrote
> Are you not used to reading charts? > > By the time the Soviets started their linear increase, NATO was already decreasing its stockpiles.
According to the chart USSR has a linear increase from the beginning while NATO decrease starts from 1967.
Maybe you considered the linear increase of USSR as starting from 1970 because after that the bars align to form a line?
bremidon t1_ivfpjgn wrote
Well, I was being nice to you.
Because if we take the drop from NATO into account, it's no longer a straight line and is therefore an exponential curve.
It's hard to say what kind of increase there might be in the beginning...you would have to eyeball it on a graph form that is not really well designed for it.
Large_Assignment_957 t1_ivfujvr wrote
The USA is behind! We need to be able to obliterate the world more than Russia! More nukes!!!!!!!!!!
AshbyLaw t1_ivfy5iv wrote
> it's no longer a straight line and is therefore an exponential curve.
It doesn't matter for my point if USSR's increase was linear or exponential
Fummy t1_ivxy9wn wrote
You could probably destory a small fraction of the surface if you tried hard enough.
talon38c t1_iw64vkn wrote
China is so secretive I doubt that anyone outside of the PLA even knows what the numbers are.

eqqqxy OP t1_ivdjtkn wrote
Source: https://fas.org/issues/nuclear-weapons/status-world-nuclear-forces/
Tool: Canva, Tableau