Submitted by jamesknightmare994 t3_ybxlf1 in dataisbeautiful
Comments
NateF150 t1_itjph4x wrote
I think you should add a second axis and show that K/D ratio bruh!
OldBowerstone t1_itl48rj wrote
As a Minnesota fan who plays the Cards in a few weeks… Data is Beautiful.
JPAnalyst t1_itj4wxd wrote
Could explain these late season dips https://twitter.com/jaydpauley/status/1484285598949154821?s=21&t=-In_ldLRWeeQ7jthHkMCdw
jamesknightmare994 OP t1_itj5uv2 wrote
I appreciate it!
JPAnalyst t1_itj5z2a wrote
This is funny. Post to r/NFL.
[deleted] t1_itj4k5h wrote
[deleted]
jamesknightmare994 OP t1_itjhby7 wrote
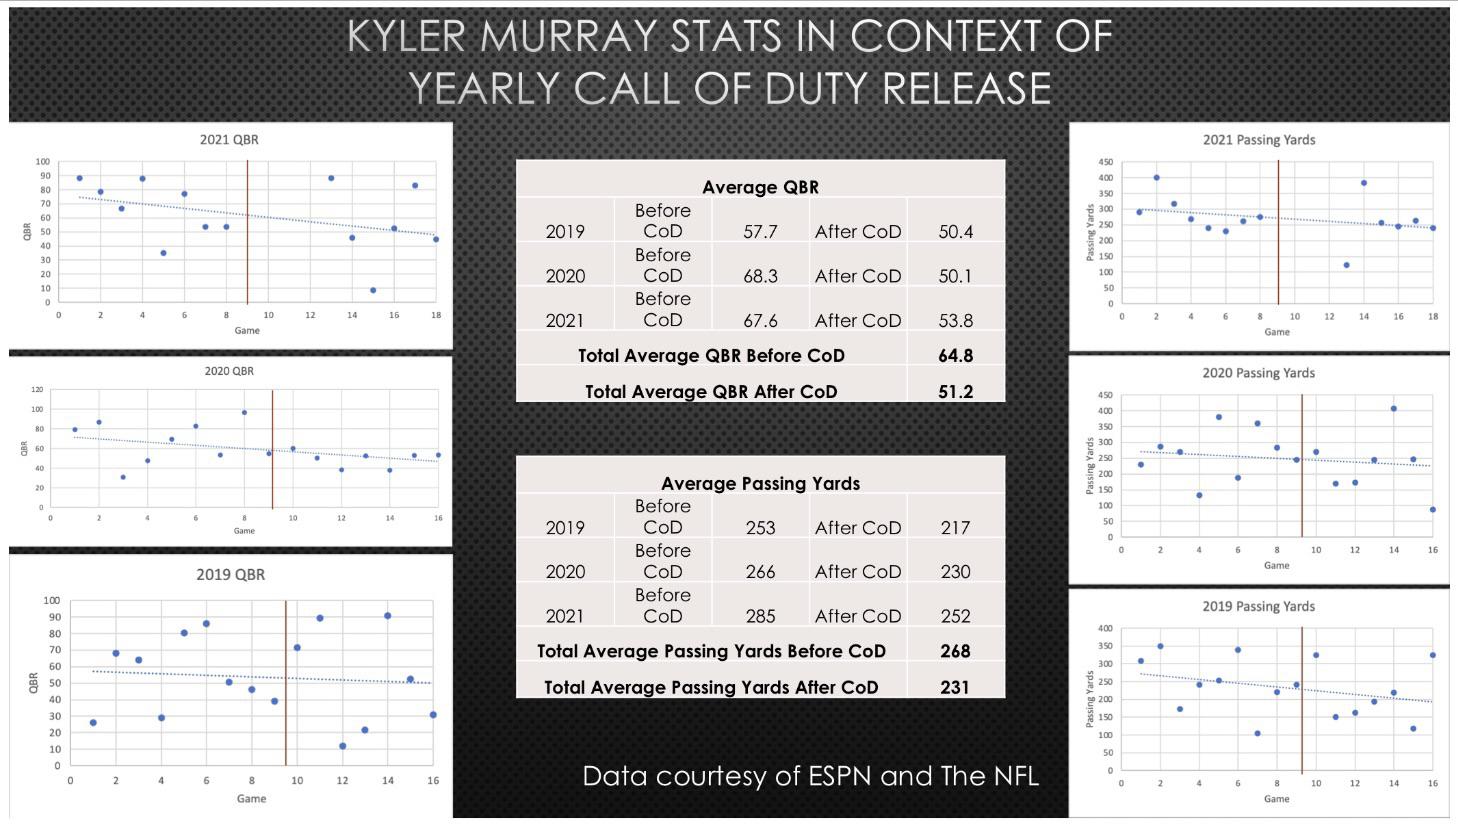
Created using excel and power point
5James5 t1_iu7nltt wrote
This is great! Join us in r/James <3

jamesknightmare994 OP t1_itj3ur7 wrote
I’m not saying Kyler Murray is a worse quarterback after Call of Duty comes out every season. I am just saying the data could easily be read like that.
Source:
https://www.espn.com/nfl/player/gamelog/_/id/3917315/kyler-murray