Comments
GeneralMe21 t1_itz8svy wrote
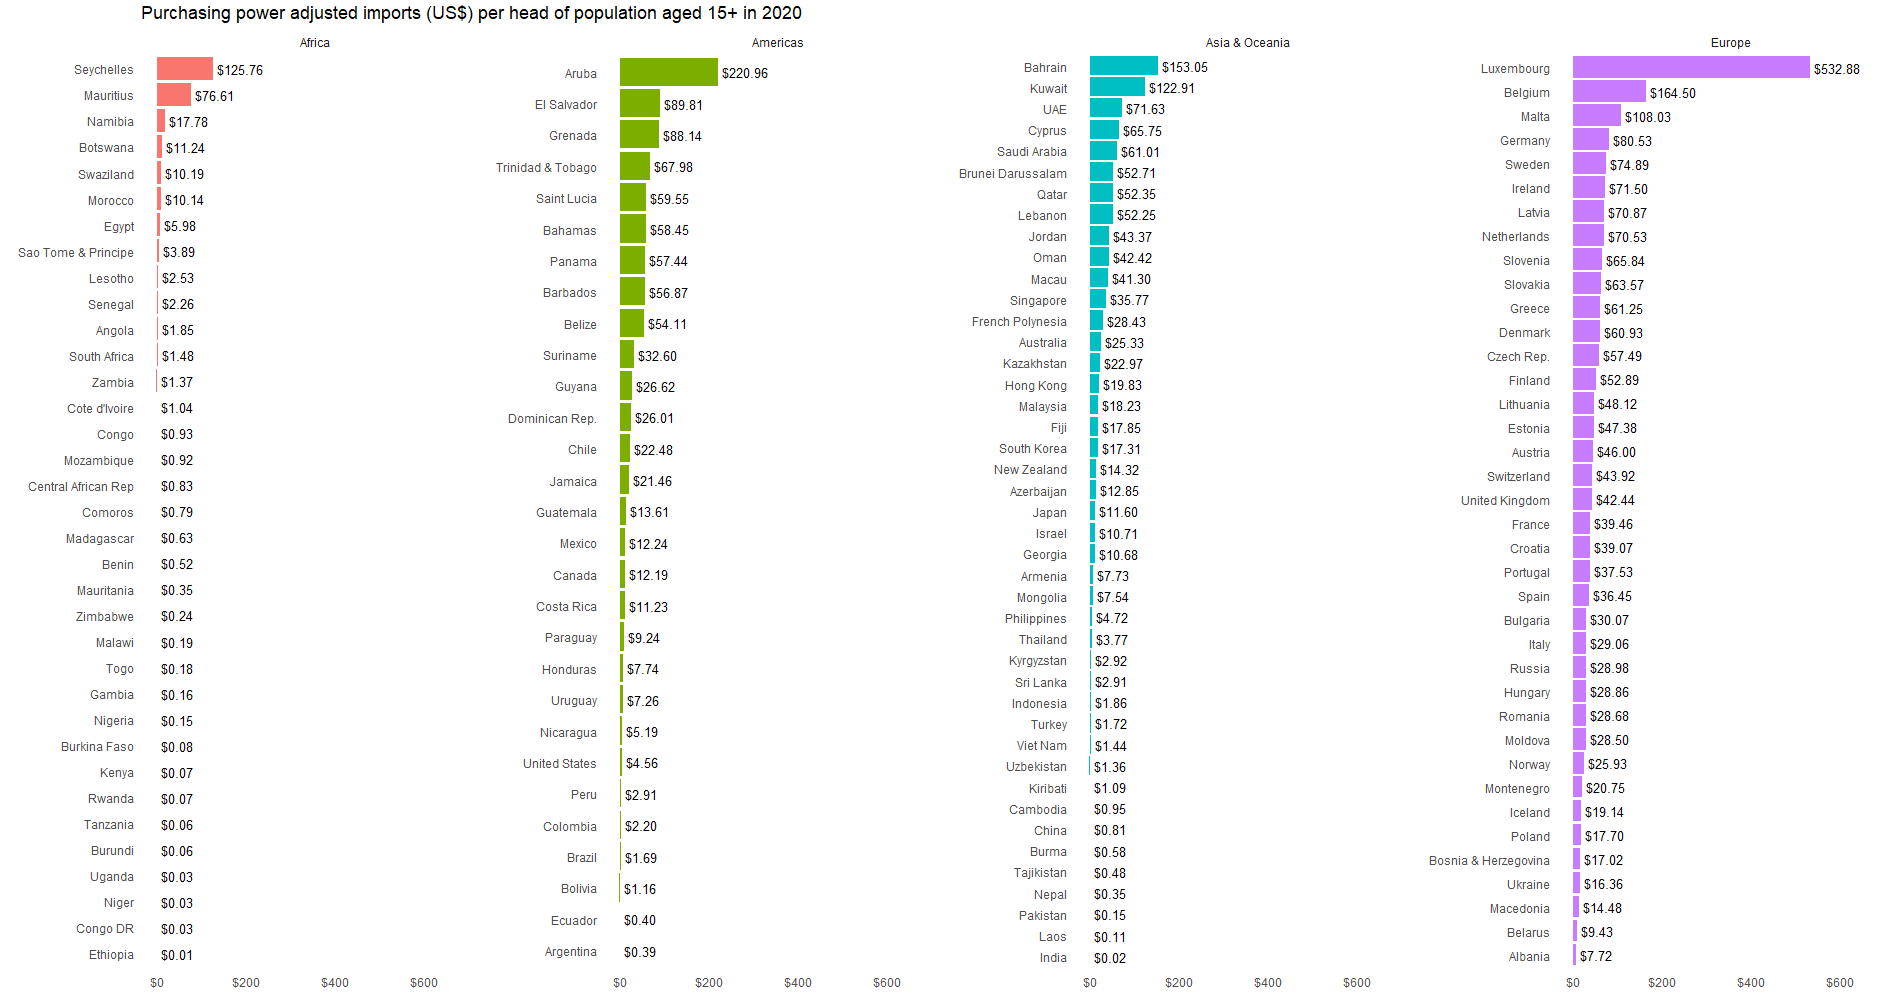
Luxembourg importing the big cheese.
MrBookman_LibraryCop OP t1_itz98pc wrote
They have a lot of money to do it! And they don't really produce much themselves as far as I'm aware
GherkinEnthusiast t1_itza0w0 wrote
Surprised South Africa is so low, although we have a saying 'cheese-boy' meaning a rich kid, because cheese is so expensive.
MrBookman_LibraryCop OP t1_itzb4ex wrote
Do you produce a lot yourself maybe? What cheeses are you hiding over there??
GherkinEnthusiast t1_itzc7hr wrote
As far as I know, we do produce a lot of our own cheeses. Our Brie and Camembert are fantastic, personal experience.
Professional-Honey27 t1_iu0gcqp wrote
actually it is just all the kochkaas
MrBookman_LibraryCop OP t1_iu14ywx wrote
Spot on

MrBookman_LibraryCop OP t1_itz6f9t wrote
I like cheese and data analysis so I made this.
I went with a purchasing power adjusted imports value because I was interested in seeing what the differences in import values are taking into account the widely varying prices across the world. In other words, placing two people from e.g. Guatemala and Germany on equal footing, who imports more cheese? (it's Germany)
Data sources and tools: