Submitted by SnthesisInc t3_11wjs2g in dataisbeautiful
Comments
SnthesisInc OP t1_jcy937l wrote
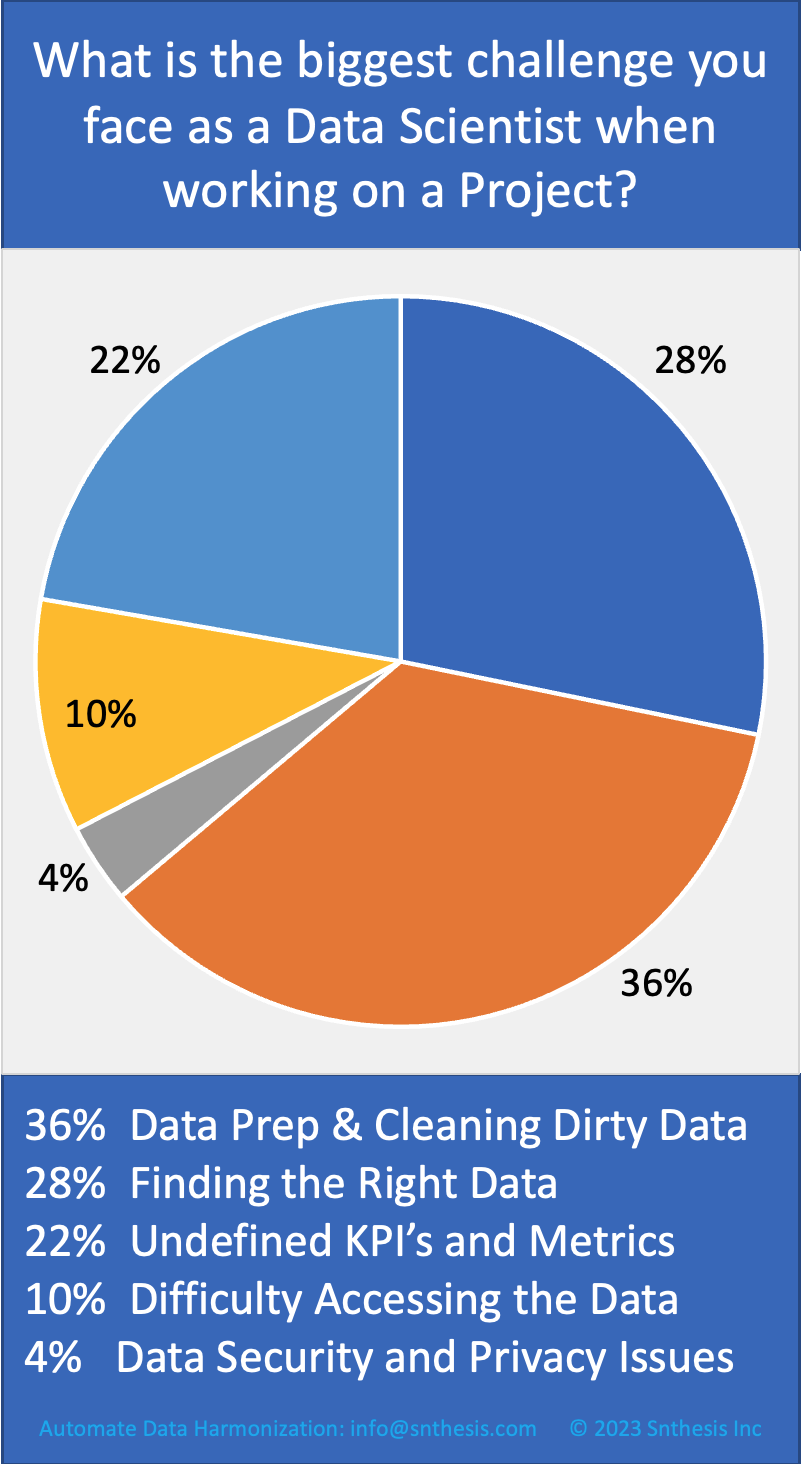
Data from r/datascience poll.
Infographic made with Adobe Illustrator.
Omaha4Loot t1_jcy9n21 wrote
Finding data that is applicable to the premise at hand and deciding whether has value is always the biggest question for me
DAFPPB t1_jcy9trh wrote
I’m being a bit nit picky but either colouring the text to match up with the pie or creating some numeric legend would improve the readability.
It matches up with the lifecycle during a sprint. 😂
Hsinats t1_jcyaf3t wrote
This is a tough graph to read easily; the colour is completely redundant. You might as well have just shown the table at the bottom because it shows all the information without having to cross check with anything else.
[deleted] t1_jcybaxy wrote
[removed]
DutchVortex t1_jcybdk3 wrote
Cleaning was nearly 80% of my work for some projects...
FluffzMcPirate t1_jcyd23d wrote
I don't like this graph. Why add color if you're not gonna use it. You could leave out the piechart from this picture and it would be easier to understand.
[deleted] t1_jcyd30u wrote
[deleted]
[deleted] t1_jcyd3zg wrote
[deleted]
[deleted] t1_jcyd6qd wrote
[deleted]
hopingforabetterpast t1_jcyfn5w wrote
17% color coding the pie but not the labels
12% not ordering the slices by size nor chronologically
37% no sample size and no sources
53% percentages in this comment not adding up to 100%
ryansdayoff t1_jcygr28 wrote
Wow all my gripes in one place
moglito t1_jcypn36 wrote
A legend that uses values as keys? That's so silly. What if two of the values were the same?
Psidom t1_jcyu18z wrote
People don't have to deal with data size and scalability issue? For me, I found it quite a pain having to make sure data fits the machine for in memory analytics. And handle OOM even when using parallel engine like Apache Spark.
Aggressive-Wrap-1246 t1_jd1uyjx wrote
Thank you, very insightful, impeccable timing.
Aggressive-Wrap-1246 t1_jd1v5bb wrote
Admittedly I used the table not the pie.
Rear-gunner t1_jedeonr wrote
The results of the poll are very much my experience.

[deleted] t1_jcy934j wrote
[removed]