Submitted by PrinticeDev t3_11sjmth in dataisbeautiful
Comments
hotmale_775 t1_jcga3pb wrote
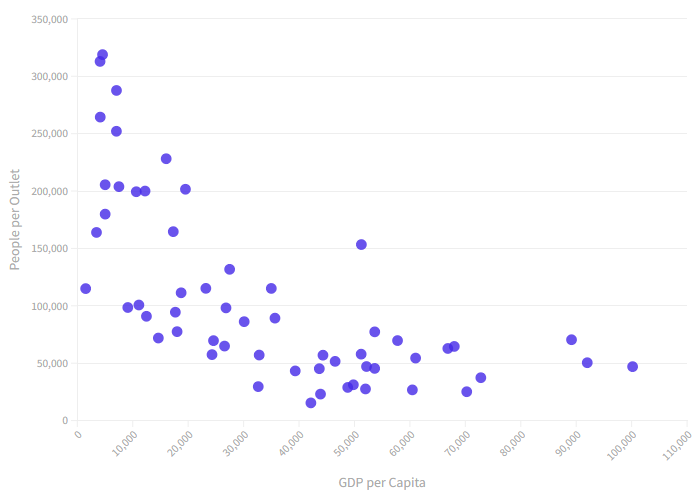
Almost perfect inverse relation xy=c
PrinticeDev OP t1_jcei7bd wrote
Actually, GDP per capita rises as there are more McDonalds, as this graph's y-axis is "people per outlet". The more people per outlet, the less GDP per capita, which means that McDonalds is actually more in demand in higher-income countries
TheCriticalAmerican t1_jcekyms wrote
You can't really make any inferences like you were saying. I went to your source, and People Per Outlet just seems like population divided by the number of stores in that country. I thought it was like an average of visitors per store, or even total number of transactions divided by the population.
Basically, what your graph shows is McDonalds Per Capita vs. GDP Per Capita. Which, I'm not sure what exactly useful information can be taken from that.
idareet60 t1_jcezq0x wrote
Going by anecdotal evidence the middle class would go to McDonald's whereas in the States that's not the case. So it does seem like a case of inferior good but I agree that this data doesn't tell us much.
PrinticeDev OP t1_jcpepfn wrote
Yup, I'm very aware - just making an observation
PrinticeDev OP t1_jce3j8n wrote
Sources:
https://en.wikipedia.org/wiki/List_of_countries_with_McDonald%27s_restaurants
https://en.wikipedia.org/wiki/List_of_countries_by_GDP_(nominal)_per_capita
The more McDonald's chains, the more the GDP per capita

TheCriticalAmerican t1_jce6rc4 wrote
So, McDonald's is an inferior good (in the economic sense). Nice graph that shows it.