Submitted by adamjonah t3_11mvxss in dataisbeautiful
Comments
adamjonah OP t1_jbjyb79 wrote
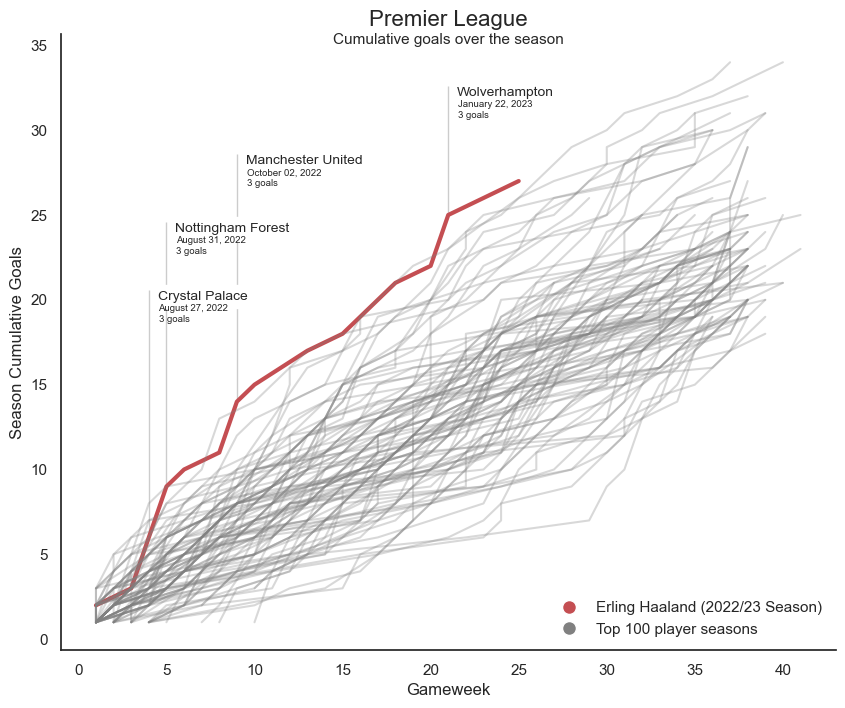
That was Mark Viduka's 2002/03 season, he scored 7 goals over 4 games, including a hat-trick against Charlton Athletic.
TheKingMonkey t1_jbk6jef wrote
adamjonah OP t1_jbjwftb wrote
This is OC, though before I posted I searched the sub so thought I'd mention u/BoMcCready who seemed to have done a similar visualisation before me!
Tools: Python (pandas/seaborn)
Source: premierleague.com - scraped the data with Python
cdmpants t1_jblf249 wrote
Hang on I can't see the chart I gotta wipe these hairs off my screen
velvlad t1_jbnn3hz wrote
Why aren't there straight horizontal lines? It looks like every player scored in every game.
adamjonah OP t1_jbnnezx wrote
The way I structured the data meant there were only values for goals, so it basically interpolates between two games where goals were scored.
PixieBaronicsi t1_jbkubv2 wrote
Are you sure that’s Gameweek on the X axis, and not game played in? I’m just wondering why some lines stop before the end
adamjonah OP t1_jbl1vxc wrote
Yeah the way I created the data I didn't extend every value to the end of the season, so basically there are no horizontal lines, if they don't score another goal the line just stops.
djdood0o0o t1_jbrxp2n wrote
Why does it go to 40 instead of 38?
adamjonah OP t1_jbsshn4 wrote
I'd have to check specifically but I scraped from the very beginning of the Premier League data on their website, I think that in the 90s there were 22 teams not 20 so that's probably the reason.
djdood0o0o t1_jbsxmyk wrote
Yeah i thought that could be the answer. I suppose it would only have to take 1 season of that rule for it to change the graph. Very interesting table anyway.

BadassFlexington t1_jbjwyzx wrote
I wanna know who's at the bottom, plateauing until around game 30 where they just go insane.