Submitted by rosetechnology t3_11d9tm5 in dataisbeautiful
Comments
mikeholczer t1_ja7feg6 wrote
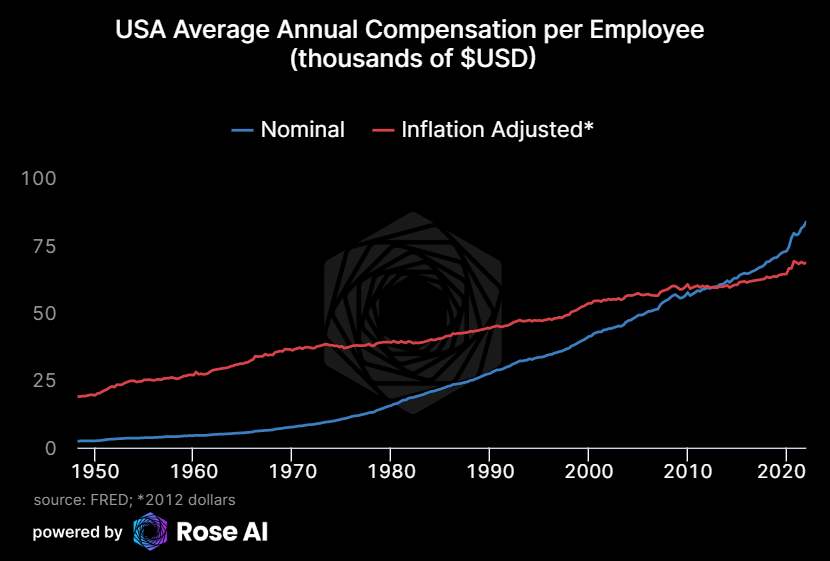
Why in 2012 dollars? Doing so causes the lines to intersect there, but I think many people will assume the intersection is means something more than that. Why not use 1950 dollars?
SchlagMichHalt t1_ja7in9h wrote
The median would contain much more value than the average. Only knowing that the average is rising could also mean compensation decreases for the lower 90% and increases for the highest 10%
[deleted] t1_ja7jz0m wrote
[deleted]
ButterflyCatastrophe t1_ja7s1dp wrote
I'd like to see both median and mean for exactly that reason. My bias is that most of the compensation increase has gone to the top, and it'd be nice to see that bias tested. Top has definitely had larger gains than the middle and bottom, but the top is also a small fraction of the total.
kungpaocheese t1_ja7wq39 wrote
Yeah it's kind of like if you look at the average salary of an SEC college athletics department. Now look at the median. Big difference when you figure how much the coaches are paid versus the part time athletic trainer.
Til_W t1_ja8fmxi wrote
2012 dollars are a fairly popular standard, also used by the source. I would have chosen 2022 dollars, but it really doesn't actually mean something.
[deleted] t1_jaad6wj wrote
[deleted]

rosetechnology OP t1_ja7dbd0 wrote
Sources: Real GDP, Labor Force. GDP, Labor % GDP
Generated using Rose AI